
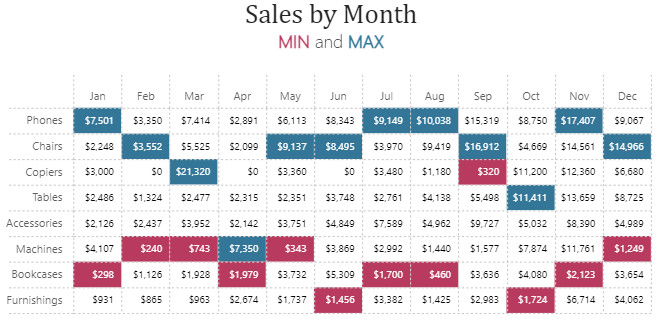
The chart was posted as part of the Tableau Workout Wednesday 2018 challenge.
I was not able to add the GRAND TOTAL column to the matrix, maybe someone can provide a solution to that.
Dataset
The dataset can be found on the Workout Wednesday link above. Added a calculated table
Date
1
2
3
4
5
6
7
8
9
10
11
12
13
14
15
16
17
18
Date =
VAR __StartYear = YEAR ( MIN ( Orders[Order Date] ) )
VAR __EndYear = YEAR ( MAX ( Orders[Order Date] ) )

VAR __StartDate = DATE ( __StartYear, 1, 1 )
VAR __EndDate = DATE ( __EndYear, 12, 31 )

VAR __Calendar =
    CALENDAR ( __StartDate, __EndDate )

RETURN
ADDCOLUMNS (
    __Calendar,
    "Month", FORMAT (  EOMONTH ( [Date], 0 ), "MMM" ),
    "Monthend_Date", EOMONTH ( [Date], 0 ),
    "Year", YEAR ( [Date] ),
    "MonthSortId", MONTH ( [Date] )
)
Additional fields created
MinMax
1
2
3
4
5
6
7
8
9
10
11
12
13
14
15
16
17
18
19
20
21
22
MinMax =
VAR __Table1 =
    CALCULATETABLE(
        ADDCOLUMNS (
             SUMMARIZE ( 'Orders', Products[Sub-Category] ,Dates[Month]),
            "@SalesAmt", [Sales]
        ),
        ALLSELECTED(Products[Sub-Category])
    )

VAR MinValue = MINX ( __Table1, [@SalesAmt] )
VAR MaxValue = MAXX ( __Table1, [@SalesAmt] )
VAR CurrentValue = [Sales]
VAR Result =
    SWITCH (
        TRUE,
        CurrentValue = MinValue, 1, -- 1 for MIN
        CurrentValue = MaxValue, 2, -- 2 for MAX
        0
    )
RETURN
    Result
Fields used
- Sub-Category
- Sales
- Month
- MonthSortId
- MinMax
Specification
1
2
3
4
5
6
7
8
9
10
11
12
13
14
15
16
17
18
19
20
21
22
23
24
25
26
27
28
29
30
31
32
33
34
35
36
37
38
39
40
41
42
43
44
45
46
47
48
49
50
51
52
53
54
55
56
57
58
59
60
61
62
63
64
65
66
67
68
69
70
71
72
73
74
75
76
77
78
79
80
81
82
83
84
85
86
87
88
89
90
91
92
93
94
95
96
97
98
99
100
{
  "height": {"step": 23},
  "data": {"name": "dataset"},
  "encoding": {
    "y": {
      "field": "Sub-Category",
      "type": "nominal",
      "axis": {
        "title": null,
        "grid": true,
        "gridColor": "#cbcbcb",
        "gridDash": [2, 2],
        "tickBand": "extent",
        "ticks": true,
        "tickDash": [2, 2],
        "tickColor": "#cbcbcb",
        "tickSize": 60,
        "labelFontSize": 10,
        "labelPadding": -50
      },
      "sort": {
        "op": "sum",
        "field": "Sales",
        "order": "descending"
      }
    },
    "x": {
      "field": "Month",
      "type": "nominal",
      "sort": {"field": "MonthSortId"},
      "axis": {
        "title": null,
        "orient": "top",
        "labelAngle": 0,
        "grid": true,
        "gridColor": "#cbcbcb",
        "gridDash": [2, 2],
        "tickBand": "extent",
        "ticks": true,
        "tickDash": [2, 2],
        "tickColor": "#cbcbcb",
        "tickSize": 30,
        "labelFontSize": 10,
        "labelPadding": -25
      }
    }
  },
  "layer": [
    {
      "mark": {
        "type": "rect",
        "tooltip": true
      },
      "encoding": {
        "color": {
          "field": "MinMax",
          "legend": null,
          "scale": {
            "domain": [0, 1, 2],
            "range": [
              "white",
              "#ba3b5e",
              "#317698"
            ]
          }
        }
      }
    },
    {
      "mark": {
        "type": "text",
        "fontSize": 9,
        "align": "right",
        "xOffset": 15
      },
      "encoding": {
        "text": {
          "aggregate": "sum",
          "field": "Sales",
          "format": "$,.0f"
        },
        "color": {
          "field": "MinMax",
          "legend": null,
          "scale": {
            "domain": [0, 1, 2],
            "range": [
              "black",
              "white",
              "white"
            ]
          }
        }
      }
    }
  ],
  "resolve": {
    "scale": {"color": "independent"}
  }
}
Config
1
2
3
4
5
6
7
8
9
10
11
12
13
14
15
16
17
18
19
20
21
22
23
24
25
26
27
28
29
30
31
32
33
34
35
36
37
38
39
40
41
42
43
44
45
46
47
48
49
50
51
52
53
54
55
56
57
58
59
60
61
62
63
64
65
66
67
68
69
70
71
{
  "autosize": {
    "type": "fit",
    "contains": "padding"
  },
  "view": {"stroke": "transparent"},
  "font": "Segoe UI",
  "arc": {},
  "area": {
    "line": true,
    "opacity": 0.6
  },
  "bar": {},
  "line": {
    "strokeWidth": 3,
    "strokeCap": "round",
    "strokeJoin": "round"
  },
  "path": {},
  "point": {"filled": true, "size": 75},
  "rect": {},
  "shape": {},
  "symbol": {
    "strokeWidth": 1.5,
    "size": 50
  },
  "text": {
    "font": "Segoe UI",
    "fontSize": 12,
    "fill": "#605E5C"
  },
  "axis": {
    "ticks": false,
    "grid": false,
    "domain": false,
    "labelColor": "#605E5C",
    "labelFontSize": 12,
    "titleFont": "wf_standard-font, helvetica, arial, sans-serif",
    "titleColor": "#252423",
    "titleFontSize": 16,
    "titleFontWeight": "normal"
  },
  "axisQuantitative": {
    "tickCount": 3,
    "grid": true,
    "gridColor": "#C8C6C4",
    "gridDash": [1, 5],
    "labelFlush": false
  },
  "axisBand": {"tickExtra": true},
  "axisX": {"labelPadding": 5},
  "axisY": {"labelPadding": 10},
  "header": {
    "titleFont": "wf_standard-font, helvetica, arial, sans-serif",
    "titleFontSize": 16,
    "titleColor": "#252423",
    "labelFont": "Segoe UI",
    "labelFontSize": 13.333333333333332,
    "labelColor": "#605E5C"
  },
  "legend": {
    "titleFont": "Segoe UI",
    "titleFontWeight": "bold",
    "titleColor": "#605E5C",
    "labelFont": "Segoe UI",
    "labelFontSize": 13.333333333333332,
    "labelColor": "#605E5C",
    "symbolType": "circle",
    "symbolSize": 75
  }
}
External references
- Layering text over heatmap - used as the starting point.
- Axis - Ticks - used for the label grid lines.