
I am a regular visitor to Shad Frigui’s Github page. He did a post a while back about alcohol consumption, in which he utilized a “point” mark with a SVG path for the bottle.
We all love our icons and adding it to PowerBI just got a lot easier, with the help of Deneb Custom Visual and Font Awesome’s SVG path for their icons.
Dataset
You don’t need any dataset for this visual
Measures created
I created one measure to add to Deneb custom visual.
- Value = 1
Fields used
- Value
Steps to follow
Step 1
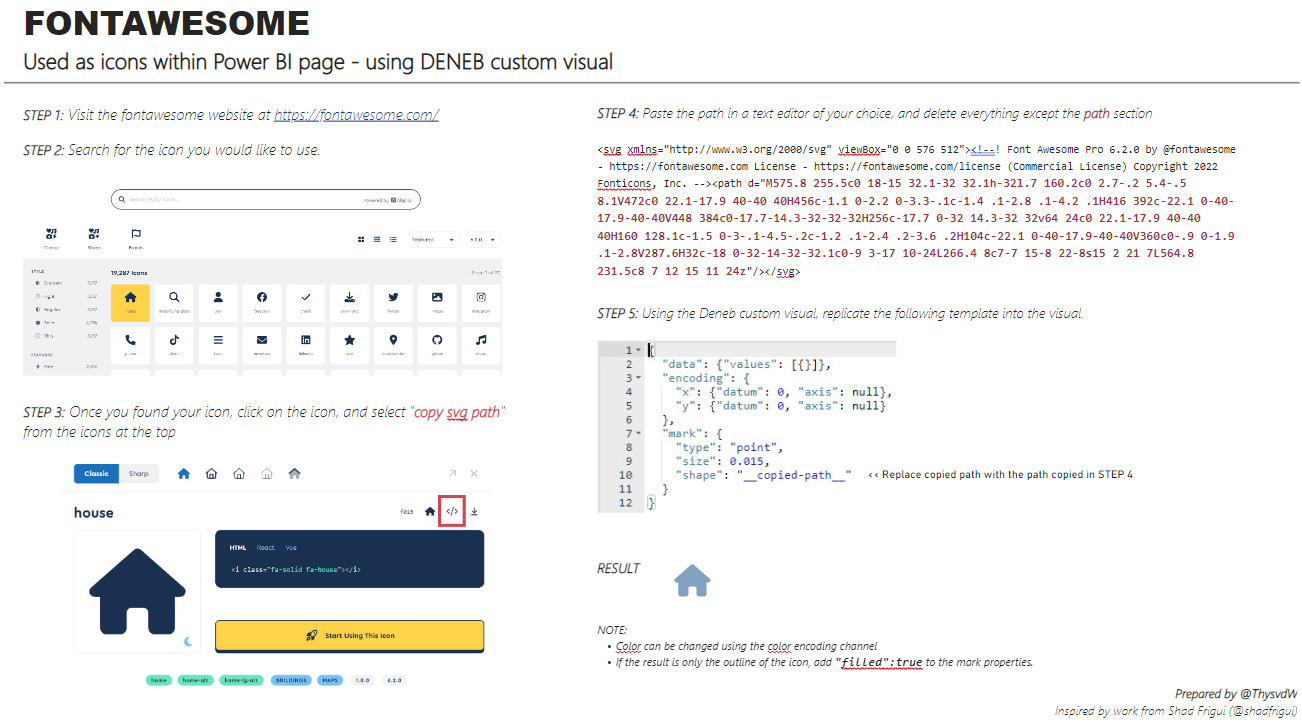
- Visit the Font Awesome website at https://fontawesome.com
Step 2
- Search for the icon you would like to use.
Step 3
- Once you found the icon, click on the icon, and select “copy svg path” from the icons at the top.
Step 4
- Paste the svg path in a text editor of your choice, and delete everything except the path section.
- The path section is from after the
<path d="to"/></svg>.<svg xmlns=”http://www.w3.org/2000/svg” viewBox=”0 0 576 512”><path d=”M575.8 255.5c0 18-15 32.1-32 32.1h-32l.7 160.2c0 >2.7-.2 5.4-.5 8.1V472c0 22.1-17.9 40-40 40H456c-1.1 0-2.2 0-3.3-.1c-1.4 .1-2.8 .1-4.2 .1H416 392c-22.1 0-40-17.9-40-40V448 384c0-17.7-14.>3-32-32-32H256c-17.7 0-32 14.3-32 32v64 24c0 22.1-17.9 40-40 40H160 128.1c-1.5 0-3-.1-4.5-.2c-1.2 .1-2.4 .2-3.6 .2H104c-22.1 0-40-17.>9-40-40V360c0-.9 0-1.9 .1-2.8V287.6H32c-18 0-32-14-32-32.1c0-9 3-17 10-24L266.4 8c7-7 15-8 22-8s15 2 21 7L564.8 231.5c8 7 12 15 11 24z”/></svg>
- The path section is from after the
5. Use the json code below, and replace the shape property value with the value of your selected icon.
1
2
3
4
5
6
7
8
9
10
11
12
13
{
  "data": {"values": [{}]},
  "encoding": {
    "x": {"datum": 0, "axis": null},
    "y": {"datum": 0, "axis": null}
  },
  "mark": {
    "type": "point",
    "filled": true,
    "size": 0.015,
    "shape": "M575.8 255.5c0 18-15 32.1-32 32.1h-32l.7 160.2c0 2.7-.2 5.4-.5 8.1V472c0 22.1-17.9 40-40 40H456c-1.1 0-2.2 0-3.3-.1c-1.4 .1-2.8 .1-4.2 .1H416 392c-22.1 0-40-17.9-40-40V448 384c0-17.7-14.3-32-32-32H256c-17.7 0-32 14.3-32 32v64 24c0 22.1-17.9 40-40 40H160 128.1c-1.5 0-3-.1-4.5-.2c-1.2 .1-2.4 .2-3.6 .2H104c-22.1 0-40-17.9-40-40V360c0-.9 0-1.9 .1-2.8V287.6H32c-18 0-32-14-32-32.1c0-9 3-17 10-24L266.4 8c7-7 15-8 22-8s15 2 21 7L564.8 231.5c8 7 12 15 11 24z"
  }
}