
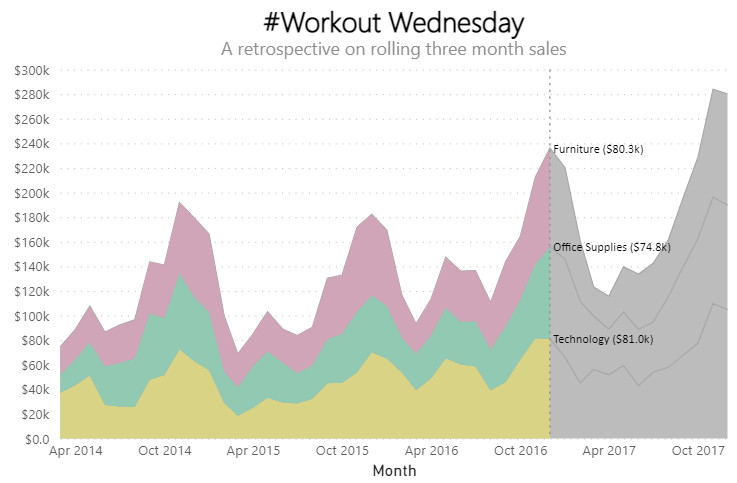
The chart was posted as part of the Tableau Workout Wednesday 2018challenge. I wasn’t able to match it exactly, but came pretty close. The chart has a date slicer for the start date of the month.
There’s more than one way to skin a cat - so please let me know if you have a different solution.
Dataset
The dataset can be found on the Workout Wednesday link above. I’ve added two calculated tables.
Date
1
2
3
4
5
6
7
8
9
10
11
12
13
14
15
16
17
18
19
20
Date =
VAR __minYear = 2014 //YEAR ( MIN ( Sales[Order Date] ) )
VAR __maxYear = 2017 //( MAX ( Sales[Order Date] ) )
VAR __fiscalPeriodStart = 7
VAR __startDate = DATE ( __minYear, 1, 1 )
VAR __endDate = DATE ( __maxYear, 12, 31 )

RETURN
ADDCOLUMNS (
    CALENDAR( __startDate, __endDate ),
    "Year", YEAR ( [Date] ),
    "Month", MONTH ( [Date] ),
    "Monthend", FORMAT ( EOMONTH( [Date], 0 ), "mmm YYYY" ),
    "MonthStart_Date", STARTOFMONTH([Date]),
    "MonthEnd_Date", EOMONTH([Date], 0),
    "MonthnYear", FORMAT ( EOMONTH ( [Date], 0 ), "yyyymm" ) * 100,
    "FY", "FY " &
      IF ( MONTH ([Date] ) >= __fiscalPeriodStart, YEAR ( [Date] ) + 1, YEAR ( [Date] ) ),
    "MonthOffset", DATEDIFF ( [Date], NOW (), MONTH )
)
Date Parameter
(disconnected table to set the start of the financial year)
1
2
3
4
5
6
7
8
9
10
11
12
13
14
15
Date Parameter =
VAR __minYear = 2014 //YEAR ( MIN ( Sales[Order Date] ) )
VAR __maxYear = 2017 //( MAX ( Sales[Order Date] ) )
VAR __startDate = DATE ( __minYear, 1, 1 )
VAR __endDate = DATE ( __maxYear+1, 1, 31 )

RETURN
FILTER (
    ADDCOLUMNS (
        CALENDAR( __startDate, __endDate ),
        "Day", DAY ( [Date] ),
        "MonthOffset", DATEDIFF( [Date], NOW(), MONTH )
    ),
    [Day] = 1
)
Additional fields created
3 Month rolling sales
1
2
3
4
5
6
7
8
9
10
3 Month rolling sales =
CALCULATE (
    [TotalSales],
    DATESINPERIOD (
        'Date'[Date],
        LASTDATE ( 'Date'[Date]),
        -3,
        MONTH
    )
)
Selected Date
1
2
3
4
5
6
7
8
9
10
11
12
13
SelectedDate =
VAR __CheckFiltered =
    ISFILTERED('Date Parameter'[Date] )

VAR __Results =
    SWITCH(
        __CheckFiltered,
        TRUE(), MIN('Date Parameter'[Date]),
        DATE(2014,3,1)
    )

RETURN
    __Results
ShowData
1
2
3
4
5
6
7
8
9
ShowData =
VAR __Selected = [SelectedDate]

RETURN
SWITCH ( TRUE(),
    MIN ( 'Date'[MonthStart_Date] ) < __Selected, 0,
    MIN ( 'Date'[MonthStart_Date] ) = __Selected, 1,
    2
)
Fields used
- [3 Month Rolling Sales] AS Sales
- [MonthStart_Date] AS Month
- [Category]
- [SelectedDate]
- [ShowData]
Specification
1
2
3
4
5
6
7
8
9
10
11
12
13
14
15
16
17
18
19
20
21
22
23
24
25
26
27
28
29
30
31
32
33
34
35
36
37
38
39
40
41
42
43
44
45
46
47
48
49
50
51
52
53
54
55
56
57
58
59
60
61
62
63
64
65
66
67
68
69
70
71
72
73
74
75
76
77
78
79
80
81
82
83
84
85
86
87
88
89
90
91
92
93
94
95
96
97
98
99
100
101
102
103
104
105
106
107
108
109
110
111
112
113
114
115
116
117
118
119
120
121
122
123
124
125
126
127
128
129
130
131
132
133
134
135
136
137
138
139
140
141
142
143
144
145
146
147
148
149
150
151
152
153
154
{
  "title": {
    "text":"#Workout Wednesday",
    "font": "Segoe UI Light",
    "fontSize": 25,
    "subtitle": "A retrospective on rolling three month sales",
    "subtitleFontSize": 16,
    "subtitleColor": "#8d8d8d"
    },
  "width": 650,
  "height": 430,
  "data": {"name": "dataset"},
  "layer": [
    {
      "mark": {
        "type": "area",
        "tooltip": true,
        "line": {
          "strokeWidth": 1,
          "stroke": "#A5A5A5"
        }
      },
      "encoding": {
        "x": {
          "field": "Month",
          "timeUnit": "yearmonth"
        },
        "y": {
          "field": "Sales",
          "aggregate": "sum"
        },
        "color": {
          "field": "Category",
          "type": "nominal",
          "legend": null,
          "scale": {
            "range": ["#bcbcbc"]
          }
        },
        "opacity": {"value": 1}
      }
    },
    {
      "transform": [
        {
          "filter": {
            "field": "ShowData",
            "lte": 1
          }
        }
      ],
      "mark": {
        "type": "area",
        "tooltip": true,
        "line": {
          "strokeWidth": 0,
          "stroke": "#A5A5A5"
        }
      },
      "encoding": {
        "x": {
          "field": "Month",
          "timeUnit": "yearmonth"
        },
        "y": {
          "field": "Sales",
          "type": "quantitative",
          "stack": "zero",
          "axis":
          {
            "format": "$.2s"
          }
        },
        "color": {
          "field": "Category",
          "type": "nominal",
          "legend": null,
          "scale": {
            "domain": [
              "Furniture",
              "Office Supplies",
              "Technology"
            ],
            "range": [
              "#d2a5b8",
              "#90c9b2",
              "#d8d381"
            ]
          }
        },
        "opacity": {"value": 1}
      }
    },
    {
      "transform": [
        {
          "filter": {
            "field": "ShowData",
            "equal": 1
          }
        },
        {
          "calculate": "datum['Category'] + ' (' + format(datum['Sales'],'$.3s') + ')'",
          "as": "labelTxt"
        }
      ],
      "layer": [
        {
          "mark": {
            "type": "text",
            "font": "Calibri",
            "align": "left",
            "dy": 1,
            "dx": 3
          },
          "encoding": {
            "x": {
              "aggregate": "max",
              "field": "Month",
              "timeUnit": "yearmonth",
              "title": "Month"
            },
            "y": {
              "field": "Sales",
              "type": "quantitative",
              "stack": "zero",
              "title": null
            },
            "text": {
              "field": "labelTxt"
            }
          }
        },
        {
          "mark": {
            "type": "rule",
            "color": "#8d8d8d",
            "strokeWidth": 0.5,
            "strokeDash": [2, 4]
          },
          "encoding": {
            "x": {
              "field": "Month",
              "timeUnit": "yearmonth"
            }
          }
        }
      ]
    }
  ],
  "resolve": {
    "scale": {"color": "independent"}
  }
}
Config
1
2
3
4
5
6
7
8
9
10
11
12
13
14
15
16
17
18
19
20
21
22
23
24
25
26
27
28
29
30
31
32
33
34
35
36
37
38
39
40
41
42
43
44
45
46
47
48
49
50
51
52
53
54
55
56
57
58
59
60
61
{
  "autosize": {
    "type": "fit",
    "contains": "padding"
  },
  "view": {"stroke": "transparent"},
  "font": "Segoe UI",
  "arc": {},
  "area": {
    "line": true,
    "opacity": 0.6
  },
  "bar": {},
  "path": {},
  "point": {"filled": true, "size": 75},
  "rect": {},
  "shape": {},
  "symbol": {
    "strokeWidth": 1.5,
    "size": 50
  },
  "axis": {
    "ticks": false,
    "grid": false,
    "domain": false,
    "labelColor": "#605E5C",
    "labelFontSize": 12,
    "titleFont": "wf_standard-font, helvetica, arial, sans-serif",
    "titleColor": "#252423",
    "titleFontSize": 16,
    "titleFontWeight": "normal"
  },
  "axisQuantitative": {
    "tickCount": 14,
    "grid": true,
    "gridColor": "#C8C6C4",
    "gridDash": [1, 5],
    "labelFlush": false
  },
  "axisBand": {"tickExtra": true},
  "axisX": {"labelPadding": 5},
  "axisY": {"labelPadding": 10},
  "header": {
    "titleFont": "wf_standard-font, helvetica, arial, sans-serif",
    "titleFontSize": 16,
    "titleColor": "#252423",
    "labelFont": "Segoe UI",
    "labelFontSize": 13.333333333333332,
    "labelColor": "#605E5C"
  },
  "legend": {
    "titleFont": "Segoe UI",
    "titleFontWeight": "bold",
    "titleColor": "#605E5C",
    "labelFont": "Segoe UI",
    "labelFontSize": 10,
    "labelColor": "#605E5C",
    "symbolType": "square",
    "symbolSize": 75
  }
}
External references
- Stacked Area Chart - used as the starting point.
- Filter Transform - used a lot of filters in this chart.
View chart
No chart view available.