
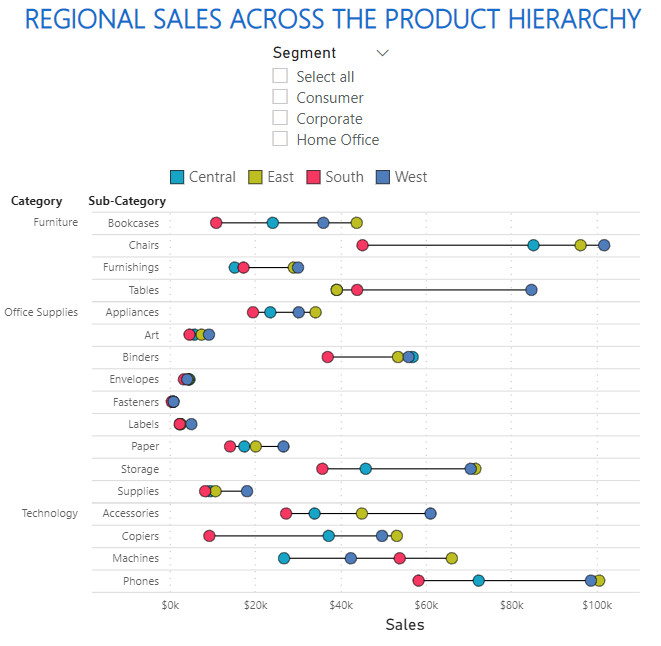
The chart was posted as part of the Tableau Workout Wednesday 2018 challenge.
Dataset
The dataset can be found on the Workout Wednesday link above.
Additional fields created
Sales
1
2
Sales =
SUM ( 'Orders'[Sales] )
Fields used
- Category
- Sub-Category
- Region
- Sales
Specification
1
2
3
4
5
6
7
8
9
10
11
12
13
14
15
16
17
18
19
20
21
22
23
24
25
26
27
28
29
30
31
32
33
34
35
36
37
38
39
40
41
42
43
44
45
46
47
48
49
50
51
52
53
54
55
56
57
58
59
60
61
62
63
64
65
66
67
68
69
70
71
72
73
74
75
76
77
78
79
80
81
82
83
84
85
86
87
88
89
90
91
92
93
94
95
96
97
98
99
100
101
102
103
104
105
106
107
108
109
110
111
112
113
114
115
116
117
118
119
120
121
122
123
124
125
126
127
128
129
130
131
132
133
134
135
136
137
138
139
140
141
142
143
144
145
146
{
  "data": {"name": "dataset"},
  "spacing": -8,
  "facet": {
    "row": {
      "field": "Category",
      "header": {
        "title": null,
        "labelAlign": "left",
        "labelAngle": 0,
        "labelAnchor": "end",
        "labelBaseline": "line-top",
        "labelLineHeight": 20,
        "labelFontSize": 10
      }
    }
  },
  "spec": {
    "width": 420,
    "layer": [
      {
        "mark": {"type": "rule"},
        "encoding": {
          "y": {
            "field": "Sub-Category",
            "type": "nominal",
            "axis": {
              "grid": true,
              "gridColor": "#e0e0e0",
              "ticks": true,
              "tickColor": "#ddd",
              "tickBand": "extent",
              "tickSize": 70,
              "title": null,
              "labelFontSize": 10,
              "labelPadding": -60
            }
          },
          "x": {
            "aggregate": "min",
            "field": "Sales",
            "type": "quantitative",
            "axis": {
              "grid": true,
              "gridColor": "#c3c3c3",
              "title": "Sales",
              "labelFontSize": 10,
              "format": "$~s",
              "tickCount": 5
            }
          },
          "x2": {
            "aggregate": "max",
            "field": "Sales"
          },
          "opacity": {
            "condition": {
              "test": {
                "field": "__selected__",
                "equal": "off"
              },
              "value": 0.3
            },
            "value": 1
          }
        }
      },
      {
        "mark": {
          "type": "point",
          "tooltip": true,
          "size": 100,
          "stroke": "black",
          "strokeWidth": 0.5
        },
        "encoding": {
          "y": {
            "field": "Sub-Category",
            "type": "nominal"
          },
          "x": {
            "aggregate": "sum",
            "field": "Sales",
            "type": "quantitative"
          },
          "tooltip": [
            {
              "field": "Sales",
              "type": "quantitative",
              "format": "$,.0f"
            },
            {
              "field": "Region",
              "type": "nominal"
            },
            {
              "field": "Sub-Category",
              "type": "nominal"
            },
            {
              "field": "Category",
              "type": "nominal"
            }
          ],
          "color": {
            "field": "Region",
            "legend": {
              "title": null,
              "orient": "top",
              "symbolSize": 140,
              "symbolStrokeWidth": 0.5,
              "symbolType": "square"
            },
            "scale": {
              "domain": [
                "Central",
                "East",
                "South",
                "West"
              ],
              "range": [
                "#03a3c8",
                "#bcbf00",
                "#f73960",
                "#4d7bbc"
              ]
            }
          },
          "opacity": {
            "condition": {
              "test": {
                "field": "__selected__",
                "equal": "off"
              },
              "value": 0.3
            },
            "value": 1
          }
        }
      }
    ]
  },
  "resolve": {
    "scale": {"y": "independent"}
  }
}
Config
1
2
3
4
5
6
7
8
9
10
11
12
13
14
15
16
17
18
19
20
21
22
23
24
25
26
27
28
29
30
31
32
33
34
35
36
37
38
39
40
41
42
43
44
45
46
47
48
49
50
51
52
53
54
55
56
57
58
59
60
61
62
63
64
65
66
67
68
69
70
71
{
  "autosize": {
    "type": "fit",
    "contains": "padding"
  },
  "view": {"stroke": "transparent"},
  "font": "Segoe UI",
  "arc": {},
  "area": {
    "line": true,
    "opacity": 0.6
  },
  "bar": {},
  "line": {
    "strokeWidth": 3,
    "strokeCap": "round",
    "strokeJoin": "round"
  },
  "path": {},
  "point": {"filled": true, "size": 75},
  "rect": {},
  "shape": {},
  "symbol": {
    "strokeWidth": 1.5,
    "size": 50
  },
  "text": {
    "font": "Segoe UI",
    "fontSize": 12,
    "fill": "#605E5C"
  },
  "axis": {
    "ticks": false,
    "grid": false,
    "domain": false,
    "labelColor": "#605E5C",
    "labelFontSize": 12,
    "titleFont": "wf_standard-font, helvetica, arial, sans-serif",
    "titleColor": "#252423",
    "titleFontSize": 16,
    "titleFontWeight": "normal"
  },
  "axisQuantitative": {
    "tickCount": 3,
    "grid": true,
    "gridColor": "#C8C6C4",
    "gridDash": [1, 5],
    "labelFlush": false
  },
  "axisBand": {"tickExtra": true},
  "axisX": {"labelPadding": 5},
  "axisY": {"labelPadding": 10},
  "header": {
    "titleFont": "wf_standard-font, helvetica, arial, sans-serif",
    "titleFontSize": 16,
    "titleColor": "#252423",
    "labelFont": "Segoe UI",
    "labelFontSize": 13.333333333333332,
    "labelColor": "#605E5C"
  },
  "legend": {
    "titleFont": "Segoe UI",
    "titleFontWeight": "bold",
    "titleColor": "#605E5C",
    "labelFont": "Segoe UI",
    "labelFontSize": 13.333333333333332,
    "labelColor": "#605E5C",
    "symbolType": "circle",
    "symbolSize": 75
  }
}
External references
- Ranged Dot Plot - used as the starting point.
- Tooltip - used to generate the tooltip.