
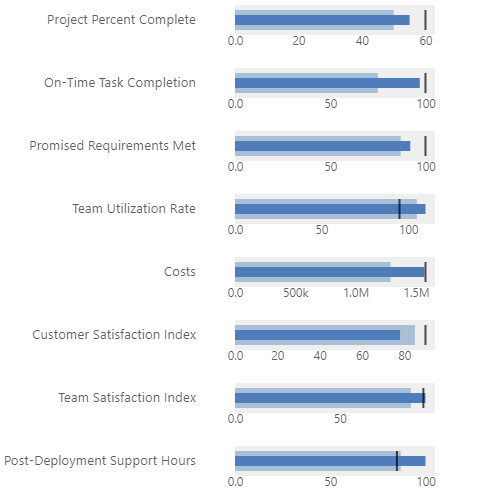
This chart was part of Week 13 Workout Wednesday challenge. For more information on the bullet chart, please see the Data Visualisation Catalogue for more information on the usage of the chart type.
Dataset
The dataset can be found on the Workout Wednesday link above.
Additional fields created
Only one additional field created in Power Query. The MaxValue for each metric. This will be used as the background bar of the bullet chart
Fields used
- Metric
- Actual
- Previous
- Goal
- MaxValue
Specification
1
2
3
4
5
6
7
8
9
10
11
12
13
14
15
16
17
18
19
20
21
22
23
24
25
26
27
28
29
30
31
32
33
34
35
36
37
38
39
40
41
42
43
44
45
46
47
48
49
50
51
52
53
54
55
56
57
58
59
60
61
62
63
64
65
66
67
68
69
70
71
72
73
74
75
76
77
78
79
80
81
82
83
84
85
86
87
88
89
90
91
92
{
  "data": {"name": "dataset"},
  "facet": {
    "row": {
      "field": "Metric",
      "sort": {
        "field": "Metric Order",
        "order": "descending"
      },
      "type": "ordinal",
      "header": {
        "labelAngle": 0,
        "title": "",
        "labelAlign": "left",
        "labelPadding": 30
      }
    }
  },
  "spacing": 20,
  "spec": {
    "encoding": {
      "x": {
        "type": "quantitative",
        "scale": {"nice": false},
        "title": null,
        "axis": {"format": ".2s"}
      },
      "tooltip": [
        {
          "field": "Actual",
          "title": "Current Actual"
        },
        {"field": "Goal"},
        {
          "field": "Previous",
          "title": "Previous Actual"
        }
      ]
    },
    "layer": [
      {
        "transform": [
          {
            "calculate": "datum.MaxValue * 1.05",
            "as": "__length__"
          }
        ],
        "mark": {
          "type": "bar",
          "color": "#efefef",
          "size": 30
        },
        "encoding": {
          "x": {"field": "__length__"}
        }
      },
      {
        "mark": {
          "type": "bar",
          "color": "#a7c0d6",
          "size": 20
        },
        "encoding": {
          "x": {"field": "Previous"}
        }
      },
      {
        "mark": {
          "type": "bar",
          "color": "#4d7bbc",
          "size": 10
        },
        "encoding": {
          "x": {"field": "Actual"}
        }
      },
      {
        "mark": {
          "type": "tick",
          "color": "black",
          "size": 20
        },
        "encoding": {
          "x": {"field": "Goal"}
        }
      }
    ]
  },
  "resolve": {
    "scale": {"x": "independent"}
  }
}
Config
1
2
3
4
5
6
7
8
9
10
11
12
13
14
15
16
17
18
19
20
21
22
23
24
25
26
27
28
29
30
31
32
33
34
35
36
37
38
39
40
41
42
43
44
45
46
47
48
49
50
51
52
53
54
55
56
57
58
59
60
61
62
63
64
65
66
67
68
69
70
71
72
73
74
75
{
    "autosize": {
      "type": "fit",
      "contains": "padding"
    },
    "view": {"stroke": "transparent"},
    "font": "Segoe UI",
    "arc": {},
    "area": {
      "line": true,
      "opacity": 0.6
    },
    "bar": {},
    "line": {
      "strokeWidth": 3,
      "strokeCap": "round",
      "strokeJoin": "round"
    },
    "path": {},
    "point": {
      "filled": true,
      "size": 75
    },
    "rect": {},
    "shape": {},
    "symbol": {
      "strokeWidth": 1.5,
      "size": 50
    },
    "text": {
      "font": "Segoe UI",
      "fontSize": 12,
      "fill": "#605E5C"
    },
    "axis": {
      "ticks": false,
      "grid": false,
      "domain": false,
      "labelColor": "#605E5C",
      "labelFontSize": 12,
      "titleFont": "wf_standard-font, helvetica, arial, sans-serif",
      "titleColor": "#252423",
      "titleFontSize": 16,
      "titleFontWeight": "normal"
    },
    "axisQuantitative": {
      "tickCount": 3,
      "grid": true,
      "gridColor": "#C8C6C4",
      "gridDash": [1, 5],
      "labelFlush": false
    },
    "axisBand": {"tickExtra": true},
    "axisX": {"labelPadding": 5},
    "axisY": {"labelPadding": 10},
    "header": {
      "titleFont": "wf_standard-font, helvetica, arial, sans-serif",
      "titleFontSize": 16,
      "titleColor": "#252423",
      "labelFont": "Segoe UI",
      "labelFontSize": 13.333333333333332,
      "labelColor": "#605E5C"
    },
    "legend": {
      "titleFont": "Segoe UI",
      "titleFontWeight": "bold",
      "titleColor": "#605E5C",
      "labelFont": "Segoe UI",
      "labelFontSize": 13.333333333333332,
      "labelColor": "#605E5C",
      "symbolType": "circle",
      "symbolSize": 75
    },
    "tick": {"thickness": 2}
  }
External references
- Bullet Chart - used as the starting point.