
The chart was posted as part of the Workout Wednesday PowerBI challenge.
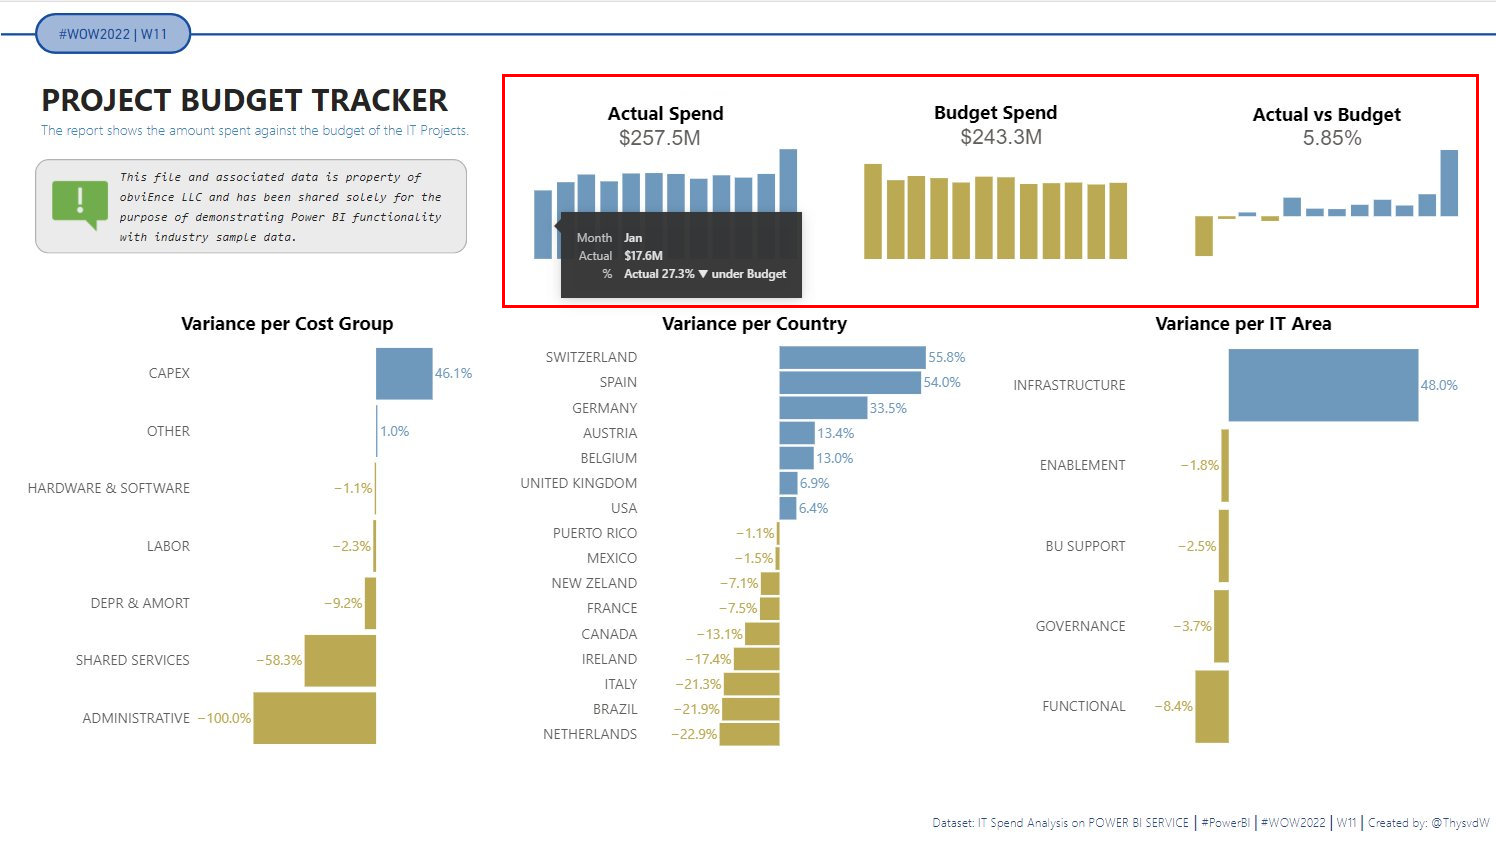
I am only going to provide the specification and configuration for the Actual Spend card visual. The others is similar in their approach.
Dataset
The dataset can be found on the Workout Wednesday link above.
Additional fields created
Actual CM
1
2
3
4
5
6
7
8
9
10
11
12
13
14
15
Actual CM =
VAR __previousMonth =
CALCULATE (
    [Actual],
    PREVIOUSMONTH('Date'[Date])
)

VAR __currentMonth =
[Actual]

VAR __month =
__currentMonth - __previousMonth

RETURN
    __month
Formatted Actual
1
2
3
4
5
6
Formatted Actual =
VAR __totalActual =
CALCULATE ( [Actual] )

RETURN
FORMAT(__totalActual/1000000,"$#.0M")
format_ACT
1
2
3
4
5
6
7
8
9
10
11
12
13
14
format_ACT =
VAR __Arrow =
IF ( [Var MO %] > 0, UNICHAR(9650), UNICHAR(9660) )

VAR __increaseTxt =
IF ( [Var MO %] > 0, "over Budget", "under Budget" )

VAR __Difference =
IF ( [Var MO %] > 0 , [Var MO %], -1 * [Var MO %] )

VAR __Percentage =
FORMAT ( __Difference, "#.0%")

RETURN "Actual " & __Percentage & " " & __Arrow & " " & __increaseTxt
Fields used
- Date AS date
- [Actual CM] AS actual
- [Formatted Actual] AS format_actual
- [format_ACT] AS format_ACT
Specification
1
2
3
4
5
6
7
8
9
10
11
12
13
14
15
16
17
18
19
20
21
22
23
24
25
26
27
28
29
30
31
32
33
34
35
36
37
38
39
40
41
42
43
44
45
46
47
48
49
50
51
52
53
54
55
56
57
58
59
60
61
62
63
64
65
66
67
68
69
70
71
72
73
74
75
76
77
78
79
80
81
{
  "title": {
    "text": "Actual Spend",
    "font": "Segoe UI",
    "fontSize": 16
  },
  "data": {"name": "dataset"},
  "layer": [
    {
      "mark": {
        "type": "bar",
        "width": 15
      },
      "encoding": {
        "color": {"value": "#6d98bd"},
        "x": {
          "field": "date",
          "type": "temporal",
          "axis": null
        },
        "y": {
          "field": "actual",
          "type": "quantitative",
          "axis": null
        },
        "tooltip": [
          {
            "field": "date",
            "type": "temporal",
            "timeUnit": "month",
            "title": "Month"
          },
          {
            "field": "actual",
            "type": "quantitative",
            "title": "Actual",
            "format": "$.3~s"
          },
          {
            "field": "format_ACT",
            "title": "%"
          }
        ]
      }
    },
    {
      "mark": {
        "type": "text",
        "xOffset": -110,
        "yOffset": 0,
        "angle": 0,
        "baseline": "bottom",
        "font": "sans-serif",
        "fontSize": 18,
        "fontStyle": "normal",
        "fontWeight": "normal",
        "limit": 0
      },
      "encoding": {
        "x": {
          "aggregate": "max",
          "field": "date",
          "type": "temporal"
        },
        "y": {
          "aggregate": {
            "argmax": "date"
          },
          "field": "actual",
          "type": "quantitative"
        },
        "text": {
          "aggregate": {
            "argmax": "date"
          },
          "field": "format_actual"
        }
      }
    }
  ]
}
Config
1
2
3
4
5
6
7
8
9
10
11
12
13
14
15
16
17
18
19
20
21
22
23
24
25
26
27
28
29
30
31
32
33
34
35
36
37
38
39
40
41
42
43
44
45
46
47
48
49
50
51
52
53
54
55
56
57
58
59
60
61
62
63
64
65
66
67
68
69
70
71
{
  "autosize": {
    "type": "fit",
    "contains": "padding"
  },
  "view": {"stroke": "transparent"},
  "font": "Segoe UI",
  "arc": {},
  "area": {
    "line": true,
    "opacity": 0.6
  },
  "bar": {},
  "line": {
    "strokeWidth": 3,
    "strokeCap": "round",
    "strokeJoin": "round"
  },
  "path": {},
  "point": {"filled": true, "size": 75},
  "rect": {},
  "shape": {},
  "symbol": {
    "strokeWidth": 1.5,
    "size": 50
  },
  "text": {
    "font": "Segoe UI",
    "fontSize": 12,
    "fill": "#605E5C"
  },
  "axis": {
    "ticks": false,
    "grid": false,
    "domain": false,
    "labelColor": "#605E5C",
    "labelFontSize": 12,
    "titleFont": "wf_standard-font, helvetica, arial, sans-serif",
    "titleColor": "#252423",
    "titleFontSize": 16,
    "titleFontWeight": "normal"
  },
  "axisQuantitative": {
    "tickCount": 3,
    "grid": true,
    "gridColor": "#C8C6C4",
    "gridDash": [1, 5],
    "labelFlush": false
  },
  "axisBand": {"tickExtra": true},
  "axisX": {"labelPadding": 5},
  "axisY": {"labelPadding": 10},
  "header": {
    "titleFont": "wf_standard-font, helvetica, arial, sans-serif",
    "titleFontSize": 16,
    "titleColor": "#252423",
    "labelFont": "Segoe UI",
    "labelFontSize": 13.333333333333332,
    "labelColor": "#605E5C"
  },
  "legend": {
    "titleFont": "Segoe UI",
    "titleFontWeight": "bold",
    "titleColor": "#605E5C",
    "labelFont": "Segoe UI",
    "labelFontSize": 13.333333333333332,
    "labelColor": "#605E5C",
    "symbolType": "circle",
    "symbolSize": 75
  }
}
External references
- Bar Charts - used as the starting point.
- Conditional KPI Cards with Deneb - Kerry is a great inspiration on her use of the Deneb custom visual.
For this chart I used her logic for coloring positive and negative values.
View chart
Due to the data being only made available via the PowerBI application, no chart view is available.