
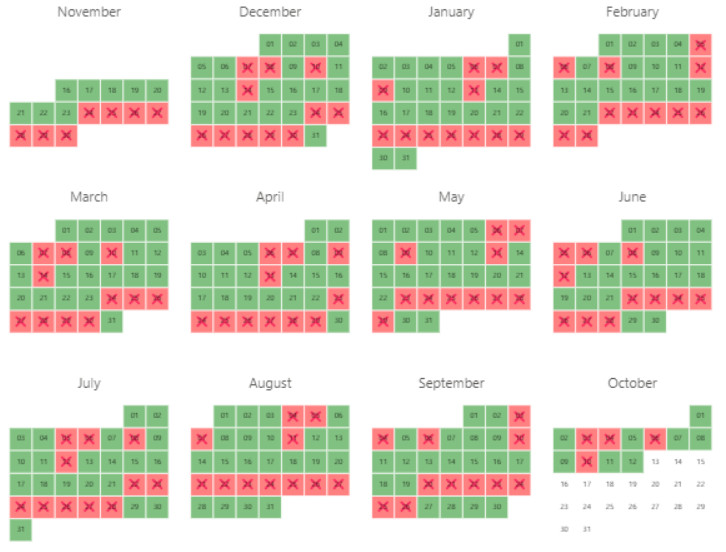
I was recently asked to create a sample report for failed data transfers, with the request being really specific. It needs to be a calendar, that will show red for failures and green for the successes. As I already had a template for the calendar, it was actually pretty straightforward with Deneb.
Dataset
You can create your own dataset for this, using the following DAX queries to generate a calculated table, and a calculated column.
1
2
3
4
5
6
7
8
9
10
11
12
13
14
15
16
17
18
19
Source =
VAR __StartDate = DATE ( 2022,1,1)
VAR __EndDate = DATE ( 2022,12,31)
VAR __Calendar = CALENDAR ( __StartDate, __EndDate )
VAR __AddColumns =
    ADDCOLUMNS (
        ADDCOLUMNS (
            __Calendar,
            "Day", WEEKDAY ( [Date] , 1 ),
            "StartOfMonth", EOMONTH( [Date] , -1 ) + 1,
            "WeekNumStartOfMonth", WEEKNUM( EOMONTH( [Date] , -1 ) + 1 ),
            "CurrentWeek", WEEKNUM([Date]),
            "AfterToday", IF ( [Date] >= TODAY(), 1, 0 )
        ),
        "Week", ([CurrentWeek] - [WeekNumStartOfMonth] ) + 1,
        "Success", IF ( [AfterToday] = 1, BLANK(), RANDBETWEEN( 0, 1 ) )
    )
RETURN
    __AddColumns
Additional fields created
No additional fields created
Fields used
- Date
- Week
- Day
- Success
Specification
The specification in a nutshell:
1
2
3
4
5
6
7
8
9
10
11
12
13
{
  ...
  "encoding":{
    "x",
    "y"
  },
  "layer":[
    {"mark":"rect"},
    {"mark":"text"},
    {"mark":"text"},
  ]
  ...
}
View chart
Open the Chart in the Vega Editor
JSON template
1
2
3
4
5
6
7
8
9
10
11
12
13
14
15
16
17
18
19
20
21
22
23
24
25
26
27
28
29
30
31
32
33
34
35
36
37
38
39
40
41
42
43
44
45
46
47
48
49
50
51
52
53
54
55
56
57
58
59
60
61
62
63
64
65
66
67
68
69
70
71
72
73
74
75
76
77
78
79
80
81
82
83
84
85
86
87
88
89
90
91
92
93
94
95
96
97
98
99
100
101
102
103
104
105
106
107
108
109
110
111
112
113
114
115
116
117
118
119
120
121
122
123
124
125
126
127
128
129
130
131
132
133
134
135
136
137
138
139
140
141
142
143
144
145
146
147
148
149
150
151
152
153
154
155
156
157
158
159
160
161
162
163
164
165
166
167
168
169
170
171
172
173
174
175
176
177
178
179
180
181
182
183
184
185
186
187
188
189
190
191
192
193
194
195
196
197
{
  "$schema": "https://vega.github.io/schema/vega-lite/v5.json",
  "usermeta": {
    "deneb": {
      "build": "1.4.0.0",
      "metaVersion": 1,
      "provider": "vegaLite",
      "providerVersion": "5.4.0"
    },
    "interactivity": {
      "tooltip": true,
      "contextMenu": true,
      "selection": false,
      "highlight": false,
      "dataPointLimit": 50
    },
    "information": {
      "name": "The one with the Calendar",
      "description": "Creates a calendar matrix with successes and failures",
      "author": "@ThysvdW",
      "uuid": "e3cb440a-9c88-4cdf-93cc-324d3d2775bd",
      "generated": "2022-10-13T21:13:09.385Z"
    },
    "dataset": [
      {
        "key": "__0__",
        "name": "Date",
        "description": "Calendar Date field",
        "type": "dateTime",
        "kind": "column"
      },
      {
        "key": "__1__",
        "name": "Day",
        "description": "Day of week (Column in the matrix)",
        "type": "numeric",
        "kind": "column"
      },
      {
        "key": "__2__",
        "name": "Week",
        "description": "Week of Month (Row in the matrix)",
        "type": "numeric",
        "kind": "column"
      },
      {
        "key": "__3__",
        "name": "Success",
        "description": "Show 0/1 for Success/Failure",
        "type": "numeric",
        "kind": "column"
      }
    ]
  },
  "config": {
    "view": {"stroke": "transparent"},
    "font": "Segoe UI",
    "arc": {},
    "area": {
      "line": true,
      "opacity": 0.6
    },
    "bar": {},
    "line": {
      "strokeWidth": 3,
      "strokeCap": "round",
      "strokeJoin": "round"
    },
    "path": {},
    "point": {
      "filled": true,
      "size": 75
    },
    "rect": {},
    "shape": {},
    "symbol": {
      "strokeWidth": 1.5,
      "size": 50
    },
    "text": {
      "font": "Segoe UI",
      "fontSize": 12,
      "fill": "#605E5C"
    },
    "axis": {
      "ticks": false,
      "grid": false,
      "domain": false,
      "labelColor": "#605E5C",
      "labelFontSize": 12,
      "titleFont": "wf_standard-font, helvetica, arial, sans-serif",
      "titleColor": "#252423",
      "titleFontSize": 16,
      "titleFontWeight": "normal"
    },
    "axisQuantitative": {
      "tickCount": 3,
      "grid": true,
      "gridColor": "#C8C6C4",
      "gridDash": [1, 5],
      "labelFlush": false
    },
    "axisX": {"labelPadding": 5},
    "axisY": {"labelPadding": 10},
    "header": {
      "titleFont": "wf_standard-font, helvetica, arial, sans-serif",
      "titleFontSize": 16,
      "titleColor": "#252423",
      "labelFont": "Segoe UI",
      "labelFontSize": 13.333333333333332,
      "labelColor": "#605E5C"
    },
    "legend": {
      "titleFont": "Segoe UI",
      "titleFontWeight": "bold",
      "titleColor": "#605E5C",
      "labelFont": "Segoe UI",
      "labelFontSize": 13.333333333333332,
      "labelColor": "#605E5C",
      "symbolType": "circle",
      "symbolSize": 75
    }
  },
  "data": {"name": "dataset"},
  "facet": {
    "field": "__0__",
    "type": "temporal",
    "timeUnit": "yearmonth",
    "header": {
      "title": null,
      "format": "%B",
      "labelFontSize": 15,
      "labelPadding": 15
    },
    "sort": {"field": "__0__"}
  },
  "spec": {
    "width": {"step": 25},
    "height": {"step": 25},
    "encoding": {
      "x": {
        "field": "__0__",
        "type": "nominal",
        "timeUnit": "day",
        "axis": null
      },
      "y": {
        "field": "__2__",
        "type": "ordinal",
        "axis": null
      }
    },
    "layer": [
      {
        "mark": {
          "type": "rect",
          "strokeWidth": 1,
          "color": {
            "expr": "datum['__3__'] == 1 ? 'green' : datum['__3__'] == 0 ? 'red' : 'transparent'"
          },
          "stroke": "#ffffff"
        },
        "encoding": {
          "opacity": {"value": 0.5}
        }
      },
      {
        "mark": {
          "type": "text",
          "size": 12,
          "text": {
            "expr": "datum['__3__'] == 0 ? '❌' : ''"
          }
        },
        "encoding": {
          "color": {"value": "#ffffff"}
        }
      },
      {
        "mark": {
          "type": "text",
          "size": 8,
          "color": "black"
        },
        "encoding": {
          "text": {
            "field": "__0__",
            "type": "temporal",
            "timeUnit": "date"
          }
        }
      }
    ]
  },
  "spacing": 20,
  "columns": 4
}