
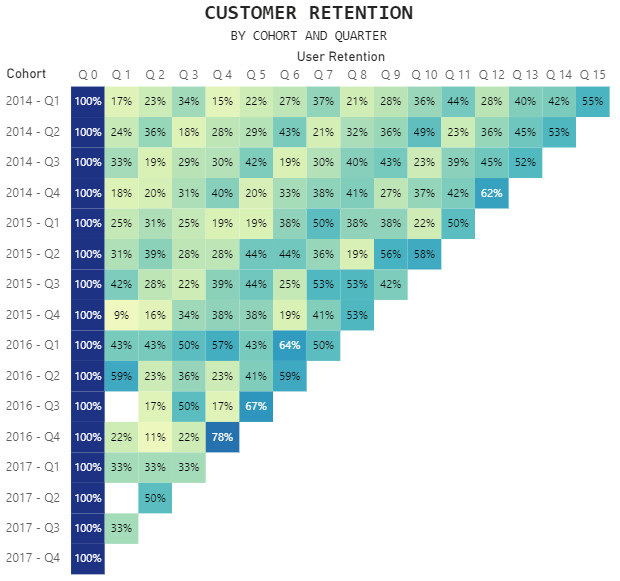
The chart was posted as part of the Tableau Workout Wednesday 2018 challenge.
Dataset
The dataset can be found on the Workout Wednesday link above.
Additional fields created
First Order
1
2
3
4
5
First Order =
CALCULATE (
    MIN('Orders'[Order Date] ),
    KEEPFILTERS( 'Customers' )
)
Cohort
1
2
3
4
5
6
7
Cohort =
VAR __Year = YEAR ( 'Customers'[First Order] )

VAR __Quarter = QUARTER( 'Customers'[First Order] )

RETURN
__Year & " - Q" & __Quarter
User Retention
1
2
3
4
5
6
7
8
9
10
11
12
User Retention =
VAR __FirstOrder =
LOOKUPVALUE( Customers[First Order], Customers[Customer ID], Orders[Customer ID] )

VAR __OrderDate =
Orders[Order Date]

VAR __DateDiff =
DATEDIFF ( __FirstOrder, __OrderDate, QUARTER )

RETURN
__DateDiff
Retention%
1
2
3
4
5
6
7
8
9
10
11
12
Retention% =
VAR __TotalCustomers =
CALCULATE(
    [# Customers],
    ALL ( Orders[User Retention] )
)

VAR __CustomersRetained =
[# Customers]

RETURN
    DIVIDE( __CustomersRetained, __TotalCustomers )
Fields used
- Cohort
- UserRetention
- Retention%
Specification
1
2
3
4
5
6
7
8
9
10
11
12
13
14
15
16
17
18
19
20
21
22
23
24
25
26
27
28
29
30
31
32
33
34
35
36
37
38
39
40
41
42
43
44
45
46
47
48
49
50
51
52
53
54
55
56
57
58
59
60
61
62
63
64
65
66
67
68
69
70
71
{
  "data": {"name": "dataset"},
  "transform": [
    {
      "calculate": "'Q ' + datum.UserRetention",
      "as": "txtLabel"
    }
  ],
  "encoding": {
    "x": {
      "field": "txtLabel",
      "type": "ordinal",
      "sort": {
        "field": "UserRetention"
      },
      "axis": {
        "labelAngle": 0,
        "labelFontSize": 11,
        "title": "User Retention",
        "titleFontSize": 13,
        "orient": "top"
      }
    },
    "y": {
      "field": "Cohort",
      "axis": {
        "titleAngle": 0,
        "labelFontSize": 11,
        "titleFontSize": 13,
        "titleX": -40,
        "titleY": -5
      },
      "type": "ordinal"
    }
  },
  "layer": [
    {
      "mark": {"type": "rect"},
      "encoding": {
        "color": {
          "field": "Retention%",
          "type": "quantitative",
          "legend": null,
          "scale": {
            "scheme": "yellowgreenblue"
          }
        }
      }
    },
    {
      "mark": {
        "type": "text",
        "fontSize": 10
      },
      "encoding": {
        "text": {
          "field": "Retention%",
          "type": "quantitative",
          "format": ".0%"
        },
        "color": {
          "condition": {
            "test": "datum['Retention%'] < .6",
            "value": "black"
          },
          "value": "white"
        }
      }
    }
  ]
}
Config
1
2
3
4
5
6
7
8
9
10
11
12
13
14
15
16
17
18
19
20
21
22
23
24
25
26
27
28
29
30
31
32
33
34
35
36
37
38
39
40
41
42
43
44
45
46
47
48
49
50
51
52
53
54
55
56
57
58
59
60
61
62
63
64
65
66
67
68
69
70
71
{
  "autosize": {
    "type": "fit",
    "contains": "padding"
  },
  "view": {"stroke": "transparent"},
  "font": "Segoe UI",
  "arc": {},
  "area": {
    "line": true,
    "opacity": 0.6
  },
  "bar": {},
  "line": {
    "strokeWidth": 3,
    "strokeCap": "round",
    "strokeJoin": "round"
  },
  "path": {},
  "point": {"filled": true, "size": 75},
  "rect": {},
  "shape": {},
  "symbol": {
    "strokeWidth": 1.5,
    "size": 50
  },
  "text": {
    "font": "Segoe UI",
    "fontSize": 12,
    "fill": "#605E5C"
  },
  "axis": {
    "ticks": false,
    "grid": false,
    "domain": false,
    "labelColor": "#605E5C",
    "labelFontSize": 12,
    "titleFont": "wf_standard-font, helvetica, arial, sans-serif",
    "titleColor": "#252423",
    "titleFontSize": 16,
    "titleFontWeight": "normal"
  },
  "axisQuantitative": {
    "tickCount": 3,
    "grid": true,
    "gridColor": "#C8C6C4",
    "gridDash": [1, 5],
    "labelFlush": false
  },
  "axisBand": {"tickExtra": true},
  "axisX": {"labelPadding": 5},
  "axisY": {"labelPadding": 10},
  "header": {
    "titleFont": "wf_standard-font, helvetica, arial, sans-serif",
    "titleFontSize": 16,
    "titleColor": "#252423",
    "labelFont": "Segoe UI",
    "labelFontSize": 13.333333333333332,
    "labelColor": "#605E5C"
  },
  "legend": {
    "titleFont": "Segoe UI",
    "titleFontWeight": "bold",
    "titleColor": "#605E5C",
    "labelFont": "Segoe UI",
    "labelFontSize": 13.333333333333332,
    "labelColor": "#605E5C",
    "symbolType": "circle",
    "symbolSize": 75
  }
}
External references
- Layering text over heatmap - used as the starting point.