
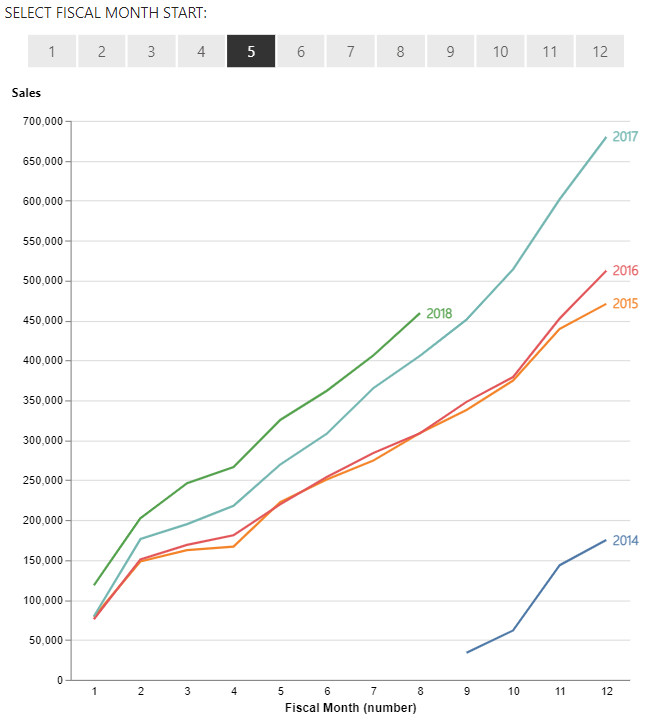
The chart was posted as part of the Tableau Workout Wednesday 2018.
Please note that there is many ways to get to the same answer. When I look back at this challenge, I might have over complicated it a lot, but it worked at that time. If you have a simpler way to get to the answer, please share and I will update the page.
Dataset
The dataset can be found on the Workout Wednesday link above.
I added a Date table to play around with the fiscal year start period.
Added Calculated Table
1
2
3
4
5
6
7
8
9
10
11
12
13
14
15
16
17
18
19
Date =
VAR __minYear = YEAR ( MIN ( Orders[Order Date] ) )
VAR __maxYear = YEAR ( MAX (Orders[Order Date] ) )
VAR __fiscalPeriodStart = 7
VAR __fiscalYearOffset = IF ( __fiscalPeriodStart > 1, 1, 0 )
VAR __startDate = DATE ( __minYear, 1, 1 )
VAR __endDate = DATE ( __maxYear, 12, 31 )

RETURN
ADDCOLUMNS (
    CALENDAR( __startDate, __endDate ),
    "Year", YEAR ( [Date] ),
    "MonthID", MONTH ( [Date] ),
    "Month", FORMAT( MONTH ( [Date] ), "MMM" ),
    "FinMonth", FORMAT ( EOMONTH ( [Date], 0 ), "MMM"),
    "FY", "FY " & IF ( MONTH ([Date] ) >= __fiscalPeriodStart, YEAR ( [Date] ) +
       __fiscalYearOffset, YEAR ( [Date] ) ),
    "FinMonthSortId", MOD ( Month ( [Date] ) - __fiscalPeriodStart, 12 ) + 1
)
Additional fields created
FiscalMonth
1
FiscalMonth = SELECTEDVALUE(FiscalMonth[FiscalMonthStart])
TotalSales
1
TotalSales = SUM ( Orders[Sales] )
Fields used
- Year of Order Date AS Year
- FinMonthSortId
- TotalSales
- FiscalMonth
Specification
1
2
3
4
5
6
7
8
9
10
11
12
13
14
15
16
17
18
19
20
21
22
23
24
25
26
27
28
29
30
31
32
33
34
35
36
37
38
39
40
41
42
43
44
45
46
47
48
49
50
51
52
53
54
55
56
57
58
59
60
61
62
63
64
65
66
67
68
69
70
71
72
73
74
75
76
77
78
79
80
81
82
83
84
85
86
87
88
89
90
91
92
93
94
95
96
97
98
99
100
101
102
103
{
  "$schema": "https://vega.github.io/schema/vega-lite/v5.json",
  "data": {"name": "dataset"},
  "height": 500,
  "width": 500,
  "transform": [
    {
      "calculate": "datum['FiscalMonth'] == 1 ? 0 : 1",
      "as": "FiscalYearOffset"
    },
    {
      "calculate": "datum['FinMonthSortId'] >= datum['FiscalMonth'] ? datum['Year'] +
        datum.FiscalYearOffset : datum['Year']",
      "as": "FiscalYear"
    },
    {
      "calculate": "datum['FinMonthSortId'] >= datum['FiscalMonth'] ?
        datum['FinMonthSortId'] - datum['FiscalMonth'] + 1 :
          (12 - datum['FiscalMonth']) + 1 + datum['FinMonthSortId']",
      "as": "FiscalMonth"
    },
    {
      "window": [
        {
          "op": "sum",
          "field": "TotalSales",
          "as": "CumulativeSales"
        }
      ],
      "groupby": ["FiscalYear"],
      "frame": [null, 0]
    }
  ],
  "layer": [
    {
      "mark": {
        "type": "line"
      },
      "encoding": {
        "x": {
          "field": "FiscalMonth",
          "axis": {"labelAngle": 0}
        },
        "y": {
          "field": "CumulativeSales",
          "type": "quantitative"
        },
        "color": {
          "field": "FiscalYear",
          "legend": null
        }
      }
    },
    {
      "encoding": {
        "x": {
          "aggregate": "max",
          "field": "FiscalMonth",
          "type": "ordinal",
          "title": "Fiscal Month (number)",
          "axis": { "ticks": false, "labelPadding": 5 }
        },
        "y": {
          "aggregate": {
            "argmax": "FiscalMonth"
          },
          "field": "CumulativeSales",
          "type": "quantitative",
          "axis":{
            "title": "TotalSales",
            "titleAngle": 0,
            "titleFont":"Segoe UI",
            "titleY": -20,
            "titleX": -40
          }
        }
      },
      "layer": [
        {
          "mark": {
            "type": "text",
            "align": "left",
            "dx": 6,
            "font": "Segoe UI Light",
            "fontWeight": "bold",
            "fontSize":12,
            "align": "left"
          },
          "encoding": {
            "text": {
              "field": "FiscalYear",
              "type": "nominal"
            },
            "color": {
              "field": "FiscalYear"
            }
          }
        }
      ]
    }
  ],
  "config": {"view": {"stroke": null}}
}
Config
No config exists for this chart.
External references
- Cumulative Frequency Distribution - used in calculating the cumulative sales value.
View chart
No chart view available.