
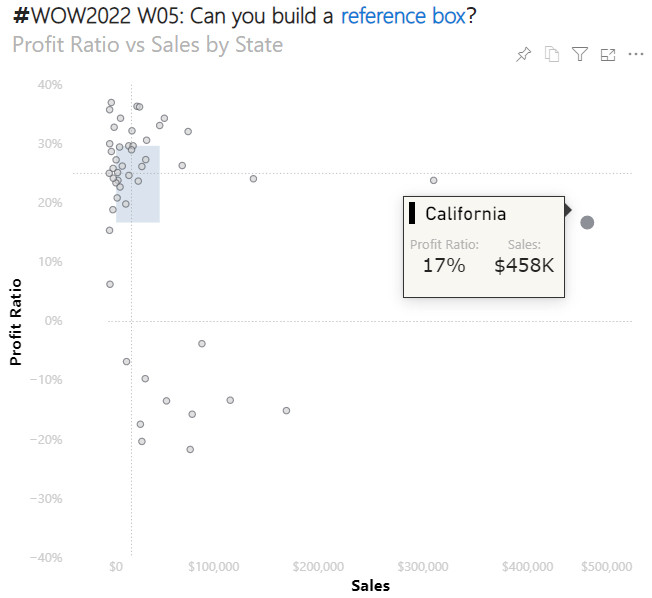
The chart was posted as part of the Tableau Workout Wednesday 2022. I was hooked! Everything Tableau can do, PowerBI can do with Deneb.
Dataset
The dataset can be found on the Workout Wednesday link above.
Additional fields created
None
Fields used
- State mapped to state
- SalesValue mapped to sales
- Profit Ratio mapped to prof
Specification
1
2
3
4
5
6
7
8
9
10
11
12
13
14
15
16
17
18
19
20
21
22
23
24
25
26
27
28
29
30
31
32
33
34
35
36
37
38
39
40
41
42
43
44
45
46
47
48
49
50
51
52
53
54
55
56
57
58
59
60
61
62
63
64
65
66
67
68
69
70
71
72
73
74
75
76
77
78
79
80
81
82
83
84
85
86
87
88
89
90
91
92
93
94
95
96
97
98
99
100
101
102
103
104
105
106
107
108
109
110
111
112
113
114
115
116
117
118
119
120
121
122
123
124
125
126
127
128
129
130
131
132
133
134
135
136
137
138
139
140
141
142
143
144
145
146
{
  "data": {"name": "dataset"},
  "layer": [
    {
      "mark": {"type": "rect"},
      "encoding": {
        "y": {
          "aggregate": "q1",
          "field": "prof"
        },
        "y2": {
          "aggregate": "q3",
          "field": "prof"
        },
        "x": {
          "aggregate": "q1",
          "field": "sales"
        },
        "x2": {
          "aggregate": "q3",
          "field": "sales"
        },
        "opacity": {"value": 0.2}
      }
    },
    {
      "params": [
        {
          "name": "pts",
          "select": {
            "type": "point",
            "fields": ["state"]
          },
          "value": [
            {"state": "New Jersey"}
          ]
        }
      ],
      "mark": {
        "type": "point",
        "stroke": "#5c6068",
        "strokeWidth":1,
        "fill": "#d3d3d3",
        "tooltip": true
      },
      "encoding": {
        "x": {
          "field": "sales",
          "type": "quantitative",
          "axis": {
            "format": "$,f",
            "tickCount": 4,
            "ticks": false,
            "labelFont": "Segoe UI",
            "labelFontSize": 11,
            "labelColor": "#cdcdcd",
            "title": "Sales",
            "titleFont": "Segoe UI",
            "titleFontSize": 14
          }
        },
        "y": {
          "field": "prof",
          "type": "quantitative",
          "axis": {
            "format": ",%",
            "ticks": false,
            "labelPadding": 40,
            "labelFont": "Segoe UI",
            "labelFontSize": 11,
            "labelColor": "#cdcdcd",
            "title": "Profit Ratio",
            "titleFont": "Segoe UI",
            "titleFontSize": 14
          },
          "scale": {
            "domain": [-0.4, 0.4]
          }
        },
        "fill": {
          "condition": {
            "param": "pts",
            "value": "#5c6068"
          },
          "value": "#d3d3d3"
        },
        "size": {
          "condition": {
            "param": "pts",
            "empty": false,
            "value": 120
          },
          "value": 30
        }
      }
    },
    {
      "mark": {
        "type": "rule",
        "strokeWidth": 0.6,
        "strokeDash": [1, 2],
        "color": "#a0a0a0"
      },
      "encoding": {
        "y": {
          "aggregate": "median",
          "field": "prof",
          "axis": {
            "format": ",%",
            "tickCount": 9
          },
          "type": "quantitative",
          "scale": {
            "domain": [-0.4, 0.4]
          }
        },
        "x2": {"datum": -30}
      }
    },
    {
      "mark": {
        "type": "rule",
        "strokeWidth": 0.6,
        "strokeDash": [1, 2],
        "color": "#a0a0a0"
      },
      "encoding": {
        "x": {
          "aggregate": "median",
          "field": "sales",
          "type": "quantitative",
          "title": "Sales"
        }
      }
    },
    {
      "mark": {
        "type": "rule",
        "strokeWidth": 0.2,
        "strokeDash": [1, 2],
        "color": "#d4d4d4"
      },
      "encoding": {"y": {"datum": 0}}
    }
  ]
}
Config
1
2
3
4
5
6
7
8
9
10
11
{
  "autosize": {
    "type": "fit",
    "contains": "padding"
  },
  "axis": {
    "grid": false,
    "domain": false
  },
  "view": {"stroke": "transparent"}
}
External references
- Ranged Rectangles - used as the starting point.
- Aggregation - used to calculate the quartiles.