
The chart was posted as part of the PowerBI Workout Wednesday 2022 challenge.
Dataset
The dataset can be found on the Workout Wednesday link above.
Additional fields created
None
Fields used
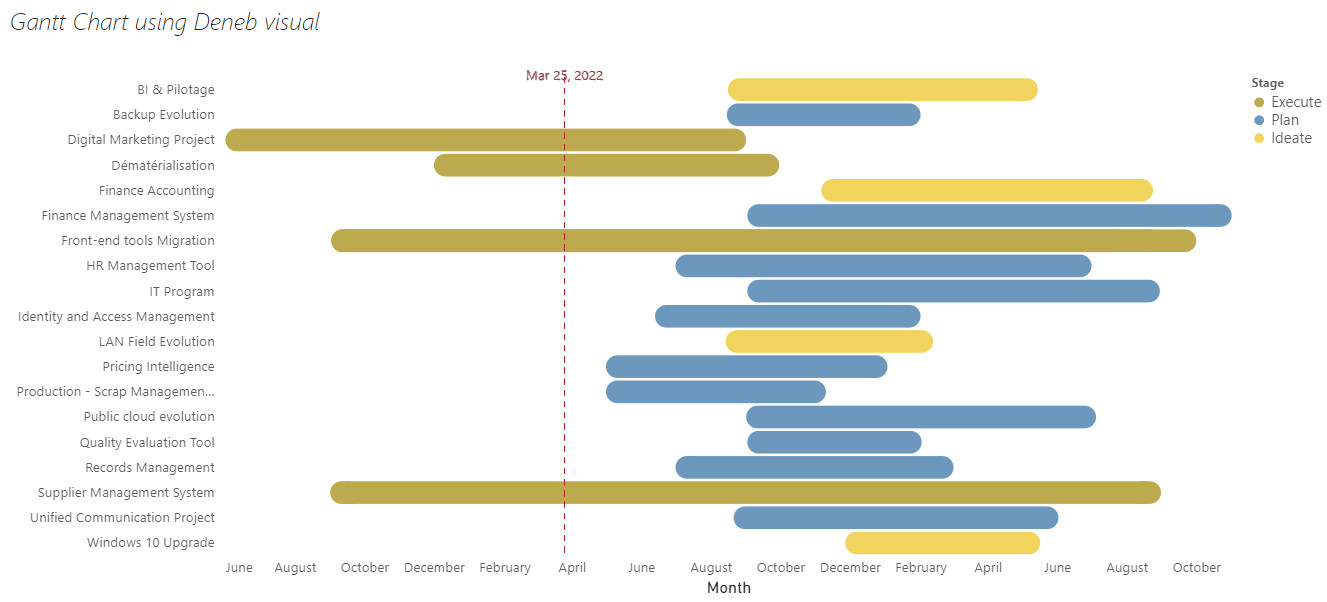
- StartDate
- EndDate
- Project
- Project Category
- Stage
Specification
1
2
3
4
5
6
7
8
9
10
11
12
13
14
15
16
17
18
19
20
21
22
23
24
25
26
27
28
29
30
31
32
33
34
35
36
37
38
39
40
41
42
43
44
45
46
47
48
49
50
51
52
53
54
55
56
57
58
59
60
61
62
63
64
65
66
67
68
69
70
71
72
73
74
75
76
77
78
79
80
81
82
83
84
85
86
87
88
89
90
91
92
93
94
95
96
97
98
99
100
101
102
103
104
105
106
{
  "data": {"name": "dataset"},
  "layer": [
    {
      "mark": {
        "type": "bar",
        "cornerRadius": 25
      },
      "encoding": {
        "x": {
          "field": "StartDate",
          "type": "temporal"
        },
        "y": {
          "field": "Project",
          "type": "ordinal",
          "sort": {
            "field": "Project Category"
          },
          "title": null,
          "axis": {"labels": true}
        },
        "x2": {"field": "EndDate"},
        "color": {
          "field": "Stage",
          "type": "ordinal",
          "scale": {
            "domain": [
              "Execute",
              "Plan",
              "Ideate"
            ],
            "range": [
              "#bea948",
              "#6c98be",
              "#f1d555"
            ]
          }
        }
      }
    },
    {
      "mark": {"type": "text"},
      "encoding": {
        "x": {
          "field": "StartDate",
          "type": "temporal",
          "title": "Month"
        },
        "y": {
          "field": "Project",
          "type": "ordinal",
          "title": null,
          "axis": {"labels": true}
        }
      }
    },
    {
      "transform": [
        {
          "calculate": "now()",
          "as": "today"
        }
      ],
      "mark": {
        "type": "rule",
        "stroke": "firebrick",
        "strokeWidth": 0.5,
        "strokeDash": [5, 5]
      },
      "encoding": {
        "x": {
          "field": "today",
          "type": "temporal"
        }
      }
    },
    {
      "transform": [
        {
          "calculate": "now()",
          "as": "today"
        }
      ],
      "mark": {
        "type": "text",
        "stroke": "firebrick",
        "strokeWidth": 0.5,
        "strokeDash": [5, 5],
        "dx": 0,
        "dy": -215
      },
      "encoding": {
        "x": {
          "field": "today",
          "type": "temporal"
        },
        "text": {
          "field": "today",
          "aggregate": "min",
          "type": "temporal"
        }
      }
    }
  ]
}
Config
Deneb was updated to v1.1, which increased the config settings, so most of these settings was as per default.
1
2
3
4
5
6
7
8
9
10
11
12
13
14
15
16
17
18
19
20
21
22
23
24
25
26
27
28
29
30
31
32
33
34
35
36
37
38
39
40
41
42
43
44
45
46
47
48
49
50
51
52
53
54
55
56
57
58
59
60
61
62
63
64
65
66
67
68
69
70
71
{
  "autosize": {
    "type": "fit",
    "contains": "padding"
  },
  "view": {"stroke": "transparent"},
  "font": "Segoe UI",
  "arc": {},
  "area": {
    "line": true,
    "opacity": 0.6
  },
  "bar": {},
  "line": {
    "strokeWidth": 3,
    "strokeCap": "round",
    "strokeJoin": "round"
  },
  "path": {},
  "point": {"filled": true, "size": 75},
  "rect": {},
  "shape": {},
  "symbol": {
    "strokeWidth": 1.5,
    "size": 50
  },
  "text": {
    "font": "Segoe UI",
    "fontSize": 12,
    "fill": "#605E5C"
  },
  "axis": {
    "ticks": false,
    "grid": false,
    "domain": false,
    "labelColor": "#605E5C",
    "labelFontSize": 12,
    "titleFont": "wf_standard-font, helvetica, arial, sans-serif",
    "titleColor": "#252423",
    "titleFontSize": 16,
    "titleFontWeight": "normal"
  },
  "axisQuantitative": {
    "tickCount": 3,
    "grid": true,
    "gridColor": "#C8C6C4",
    "gridDash": [1, 5],
    "labelFlush": false
  },
  "axisBand": {"tickExtra": true},
  "axisX": {"labelPadding": 5},
  "axisY": {"labelPadding": 10},
  "header": {
    "titleFont": "wf_standard-font, helvetica, arial, sans-serif",
    "titleFontSize": 16,
    "titleColor": "#252423",
    "labelFont": "Segoe UI",
    "labelFontSize": 13.333333333333332,
    "labelColor": "#605E5C"
  },
  "legend": {
    "titleFont": "Segoe UI",
    "titleFontWeight": "bold",
    "titleColor": "#605E5C",
    "labelFont": "Segoe UI",
    "labelFontSize": 13.333333333333332,
    "labelColor": "#605E5C",
    "symbolType": "circle",
    "symbolSize": 75
  }
}
External references
- Gantt Chart (Ranged Bar Marks) - used as the starting point.
- Bar Mark Properties - played around with the cornerRadius.