
The chart was posted as part of the PowerBI Workout Wednesday 2022 challenge.
Dataset
The dataset can be found on the Workout Wednesday link above.
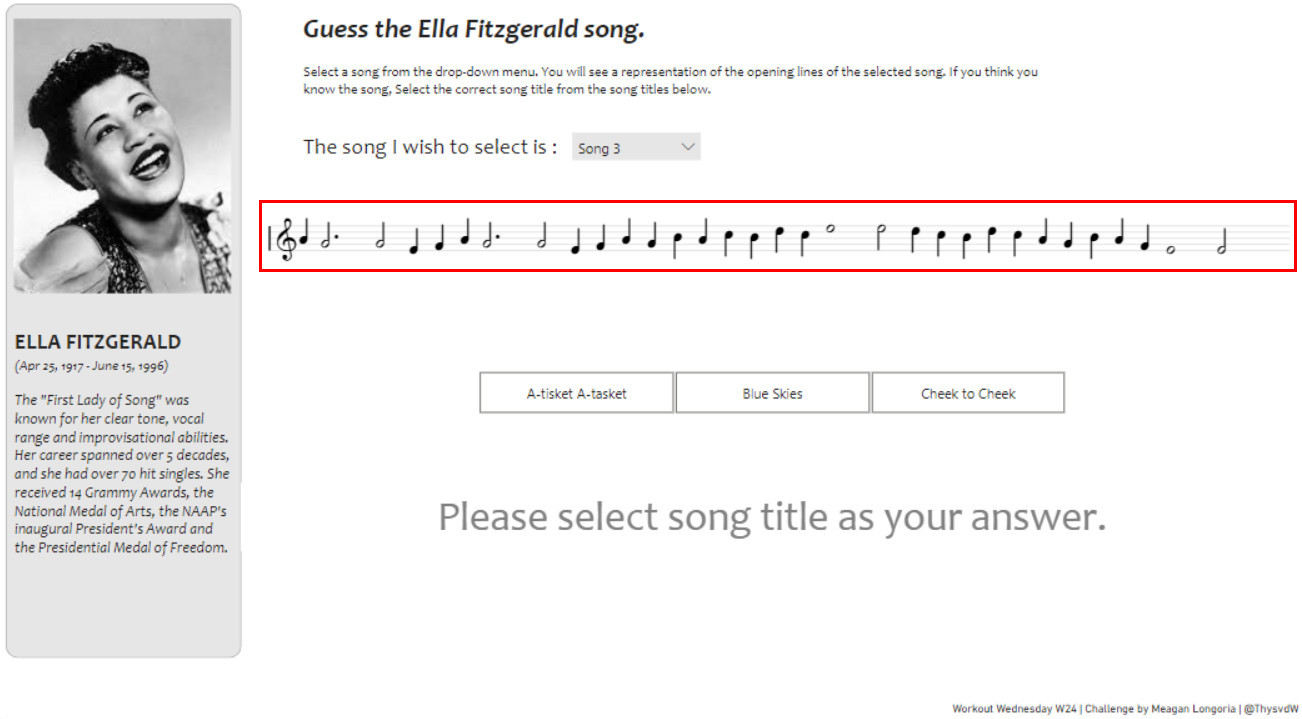
Before you continue with the template, please be mindful that I don’t have any music background. The challenge was merely done to see what is possible with Deneb and text layers.
Additional fields created
I added two rows per song to the Music Notes worksheet.
- Pitch : SingleBar / Length : 1 / Distance Middle C : 0
- Pitch : Gcleff / Length : 2 / Distance Middle C : 0
The two records above was also added to the Note Mapping worksheet, and then added a “Scale” field.
| MiddleC | Note | Scale |
|---|---|---|
| 1 | C | 6.5 |
| 1 | B | 6 |
| 1 | B-flat | 6 |
| 1 | A | 5.5 |
| 1 | A-flat | 5.5 |
| 1 | G | 5 |
| 1 | G-flat | 5 |
| 1 | F | 4.5 |
| 1 | E | 4 |
| 1 | E-flat | 4 |
| 1 | D | 3.5 |
| 1 | D-flat | 3.5 |
| 0 | C | 3 |
| -1 | B | 2.5 |
| -1 | B-flat | 2.5 |
| -1 | A | 2 |
| -1 | A-flat | 2 |
| -1 | G | 1.5 |
| -1 | G-flat | 1.5 |
| -1 | F | 1 |
| -1 | E | 0.5 |
| -1 | E-Flat | 0.5 |
| -1 | D | 0 |
| -1 | D-flat | 0 |
| -1 | C | -0.5 |
| 0 | Rest | 3 |
| 0 | SingleBar | 3 |
| 0 | Gcleff | 3 |
I then created a “KEY” column in Power Query to create a unique field to map the notes from the Music Notes to the Note Mapping table.
Fields used
- Note
- Scale
- Index
- Length
Specification
This specification can be enhanced with the song lyrics. Add the lyrics to the Music Notes worksheet, next to the corresponding note. Then add the additional text layer for the lyrics.
The specification in a nutshell:
* layer
  * text (𝅘𝅥 note length <= 2)
  * text (𝅗𝅥 note length > 2 and note length <= 5)
  * text (__ for notes that is outside of the staff)
  * text (𝅝 note length > 5)
  * text (𝄀 where the Note = 'SingleBar')
  * text (𝄞 where the Note = 'Gcleff')
  * text (𝄩 where the Note = 'Rest')
The challenge is to get the notes to align to where the “scatterplot” points are. Note that some notes has a different angle, which is possible with the “Angle” attribute to the text mark.
View chart
Open the Chart in the Vega Editor
JSON template
1
2
3
4
5
6
7
8
9
10
11
12
13
14
15
16
17
18
19
20
21
22
23
24
25
26
27
28
29
30
31
32
33
34
35
36
37
38
39
40
41
42
43
44
45
46
47
48
49
50
51
52
53
54
55
56
57
58
59
60
61
62
63
64
65
66
67
68
69
70
71
72
73
74
75
76
77
78
79
80
81
82
83
84
85
86
87
88
89
90
91
92
93
94
95
96
97
98
99
100
101
102
103
104
105
106
107
108
109
110
111
112
113
114
115
116
117
118
119
120
121
122
123
124
125
126
127
128
129
130
131
132
133
134
135
136
137
138
139
140
141
142
143
144
145
146
147
148
149
150
151
152
153
154
155
156
157
158
159
160
161
162
163
164
165
166
167
168
169
170
171
172
173
174
175
176
177
178
179
180
181
182
183
184
185
186
187
188
189
190
191
192
193
194
195
196
197
198
199
200
201
202
203
204
205
206
207
208
209
210
211
212
213
214
215
216
217
218
219
220
221
222
223
224
225
226
227
228
229
230
231
232
233
234
235
236
237
238
239
240
241
242
243
244
245
246
247
248
249
250
251
252
253
254
255
256
257
258
259
260
261
262
263
264
265
266
267
268
269
270
271
272
273
274
275
276
277
278
279
280
281
282
283
284
285
286
287
288
289
290
291
292
293
294
295
296
297
{
  "$schema": "https://vega.github.io/schema/vega-lite/v5.json",
  "usermeta": {
    "deneb": {
      "build": "1.2.0.1",
      "metaVersion": 1,
      "provider": "vegaLite",
      "providerVersion": "5.2.0"
    },
    "interactivity": {
      "tooltip": true,
      "contextMenu": true,
      "selection": false,
      "highlight": false,
      "dataPointLimit": 50
    },
    "information": {
      "name": "The one with the scatterplot sheet music.",
      "description": "A scatterplot that generates sheet music",
      "author": "Thys",
      "uuid": "52404676-5a5d-4040-93ee-4b2b5cc2901f",
      "generated": "2022-06-17T15:46:05.120Z"
    },
    "dataset": [
      {
        "key": "__0__",
        "name": "Note",
        "description": "The note description",
        "type": "numeric",
        "kind": "column"
      },
      {
        "key": "__1__",
        "name": "Scale",
        "description": "The scale of the note (Y-axis)",
        "type": "numeric",
        "kind": "measure"
      },
      {
        "key": "__2__",
        "name": "Index",
        "description": "The index of the note (X-axis)",
        "type": "numeric",
        "kind": "column"
      },
      {
        "key": "__3__",
        "name": "Length",
        "description": "The length of the note",
        "type": "numeric",
        "kind": "measure"
      }
    ]
  },
  "config": {
    "autosize": {
      "type": "fit",
      "contains": "padding"
    },
    "view": {"stroke": "transparent"},
    "font": "Segoe UI",
    "arc": {},
    "area": {
      "line": true,
      "opacity": 0.6
    },
    "bar": {},
    "line": {
      "strokeWidth": 3,
      "strokeCap": "round",
      "strokeJoin": "round"
    },
    "path": {},
    "point": {
      "filled": true,
      "size": 75
    },
    "rect": {},
    "shape": {},
    "symbol": {
      "strokeWidth": 1.5,
      "size": 50
    },
    "text": {
      "font": "Segoe UI",
      "fontSize": 12,
      "fill": "#605E5C"
    },
    "axis": {
      "ticks": false,
      "grid": false,
      "domain": false,
      "labelColor": "#605E5C",
      "labelFontSize": 12,
      "titleFont": "wf_standard-font, helvetica, arial, sans-serif",
      "titleColor": "#252423",
      "titleFontSize": 16,
      "titleFontWeight": "normal"
    },
    "axisQuantitative": {
      "tickCount": 3,
      "grid": true,
      "gridColor": "#C8C6C4",
      "gridDash": [1, 5],
      "labelFlush": false
    },
    "axisBand": {"tickExtra": true},
    "axisX": {"labelPadding": 5},
    "axisY": {"labelPadding": 10},
    "header": {
      "titleFont": "wf_standard-font, helvetica, arial, sans-serif",
      "titleFontSize": 16,
      "titleColor": "#252423",
      "labelFont": "Segoe UI",
      "labelFontSize": 13.333333333333332,
      "labelColor": "#605E5C"
    },
    "legend": {
      "titleFont": "Segoe UI",
      "titleFontWeight": "bold",
      "titleColor": "#605E5C",
      "labelFont": "Segoe UI",
      "labelFontSize": 13.333333333333332,
      "labelColor": "#605E5C",
      "symbolType": "circle",
      "symbolSize": 75
    }
  },
  "data": {"name": "dataset"},
  "height": {"step": 3},
  "encoding": {
    "x": {
      "field": "__2__",
      "type": "quantitative",
      "axis": null
    },
    "y": {
      "field": "__1__",
      "type": "nominal",
      "title": null,
      "axis": {
        "labels": false,
        "grid": true,
        "values": [1, 2, 3, 4, 5]
      },
      "scale": {
        "domain": [
          7,
          6.5,
          6,
          5.5,
          5,
          4.5,
          4,
          3.5,
          3,
          2.5,
          2,
          1.5,
          1,
          0.5,
          0,
          -0.5
        ]
      },
      "sort": {
        "field": "__1__",
        "order": "descending"
      }
    }
  },
  "layer": [
    {
      "transform": [
        {
          "filter": "datum['__3__'] <= 2 && datum['__0__'] != 'Rest'
            && datum['__0__'] != 'SingleBar' && datum['__0__'] != 'Gcleff'"
        }
      ],
      "mark": {
        "type": "text",
        "size": 30,
        "dy": -4,
        "angle": {
          "expr": "datum['__1__'] > 3 ? 180 : 0"
        }
      },
      "encoding": {
        "text": {"value": "𝅘𝅥"},
        "color": {"value": "black"}
      }
    },
    {
      "transform": [
        {
          "filter": "datum['__3__'] > 2 && datum['__3__'] <= 5 &&
              datum['__0__'] != 'Rest' && datum['__0__'] != 'SingleBar'
                && datum['__0__'] != 'Gcleff'"
        }
      ],
      "mark": {
        "type": "text",
        "size": 30,
        "dy": -5,
        "angle": {
          "expr": "datum['__1__'] > 3 ? 180 : 0"
        }
      },
      "encoding": {
        "text": {"value": "𝅗𝅥"},
        "color": {"value": "black"}
      }
    },
    {
      "transform": [
        {
          "filter": "datum['__1__'] < 0.5 || datum['__1__'] > 5.5"
        }
      ],
      "mark": {
        "type": "text",
        "size": 20,
        "dy": -7,
        "angle": {
          "expr": "datum['__1__'] > 3 ? 180 : 0"
        }
      },
      "encoding": {
        "text": {"value": "__"},
        "color": {"value": "black"}
      }
    },
    {
      "transform": [
        {
          "filter": "datum['__3__'] > 5 && datum['__0__'] != 'Rest'
            && datum['__0__'] != 'SingleBar' && datum['__0__'] != 'Gcleff'"
        }
      ],
      "mark": {
        "type": "text",
        "size": 25,
        "dy": -5
      },
      "encoding": {
        "text": {"value": "𝅝"},
        "color": {"value": "black"}
      }
    },
    {
      "transform": [
        {
          "filter": "datum['__0__'] == 'SingleBar'"
        }
      ],
      "mark": {
        "type": "text",
        "dy": 3,
        "size": 35
      },
      "encoding": {
        "text": {"value": "𝄀"},
        "color": {"value": "black"}
      }
    },
    {
      "transform": [
        {
          "filter": "datum['__0__'] == 'Gcleff'"
        }
      ],
      "mark": {
        "type": "text",
        "size": 40
      },
      "encoding": {
        "text": {"value": "𝄞"},
        "color": {"value": "black"}
      }
    },
    {
      "transform": [
        {
          "filter": "datum['__0__'] == 'Rest'"
        }
      ],
      "mark": {
        "type": "text",
        "size": 25
      },
      "encoding": {
        "text": {"value": "𝄩"},
        "color": {"value": "black"}
      }
    }
  ]
}