
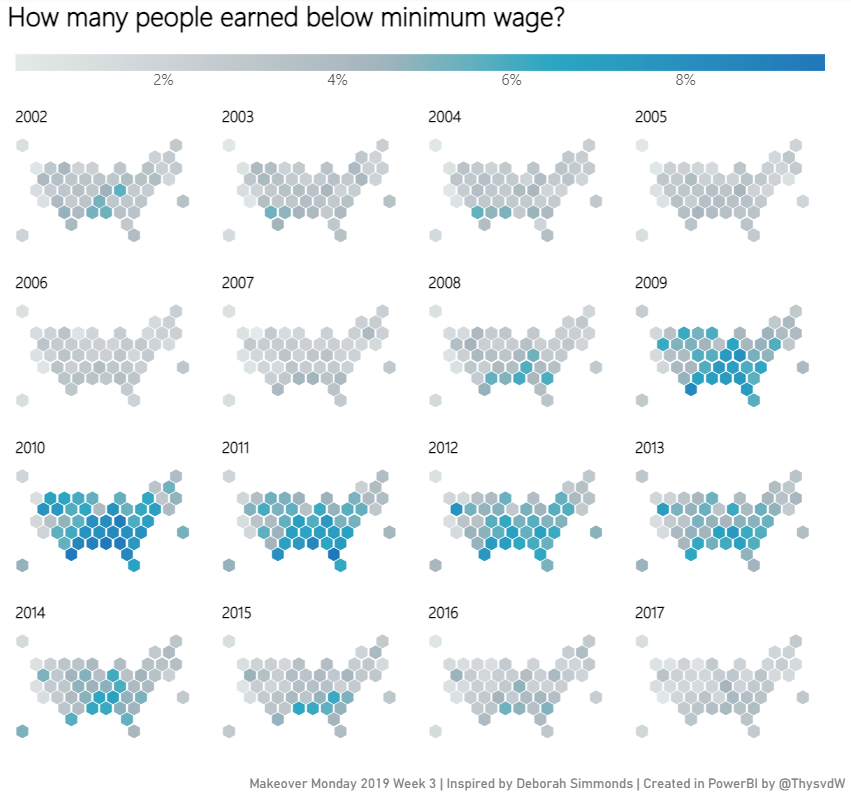
While scrolling through my twitter timeline, I came across Deborah Simmonds’s redo of a Makeover Monday graph. This seemed like an interesting redo for Deneb & PowerBI, as Shad Frigui recently published a Hex-tile map done in Vega-lite.
Dataset
The dataset can be found on the Makeover Monday website for Week 3.
You require the Excel file from the blog post by Kevin Taylor, to map the State codes to the relevant location on the chart.
Additional fields created
No additional fields created
Fields used
- Year
- Code (Country Code)
- Country (Country Description)
- Score
- Indicator (Dimension field)
Specification
The specification in a nutshell:
facet
  * per Year
spec
  * mark = text (where the text value to display is a "⬢")
  * encoding
    * x : column value
    * y : row value (descending order)
    * color : Measure
One realise the power of Deneb and Vega-lite when you notice that the code to render the hex-tile maps is only 54 lines (excl. config settings).
External references
- How to use hex-tile maps to eliminate the Alaska effect.
- Hexbin Chart in Altair.
- Vega-lite tile map.
View chart
Open the Chart in the Vega Editor
JSON template
1
2
3
4
5
6
7
8
9
10
11
12
13
14
15
16
17
18
19
20
21
22
23
24
25
26
27
28
29
30
31
32
33
34
35
36
37
38
39
40
41
42
43
44
45
46
47
48
49
50
51
52
53
54
55
56
57
58
59
60
61
62
63
64
65
66
67
68
69
70
71
72
73
74
75
76
77
78
79
80
81
82
83
84
85
86
87
88
89
90
91
92
93
94
95
96
97
98
99
100
101
102
103
104
105
106
107
108
109
110
111
112
113
114
115
116
117
118
119
120
121
122
123
124
125
126
127
128
129
130
131
132
133
134
135
136
137
138
139
140
141
142
143
144
145
146
147
148
149
150
151
152
153
154
155
156
157
158
159
160
161
162
163
164
165
166
167
168
169
170
171
172
173
174
175
176
177
178
179
180
181
{
  "$schema": "https://vega.github.io/schema/vega-lite/v5.json",
  "usermeta": {
    "deneb": {
      "build": "1.2.0.1",
      "metaVersion": 1,
      "provider": "vegaLite",
      "providerVersion": "5.2.0"
    },
    "interactivity": {
      "tooltip": true,
      "contextMenu": true,
      "selection": false,
      "highlight": false,
      "dataPointLimit": 50
    },
    "information": {
      "name": "The one with the hex-tile map",
      "description": "A hex-tile map for States of North America",
      "author": "Thys",
      "uuid": "14e7fcc1-4cc7-4dfd-a490-dcaa666dcbf7",
      "generated": "2022-06-12T12:01:19.916Z"
    },
    "dataset": [
      {
        "key": "__0__",
        "name": "Row",
        "description": "Y-axis value for US State location on map",
        "type": "numeric",
        "kind": "column"
      },
      {
        "key": "__1__",
        "name": "Column",
        "description": "X-axis value for US State location on map",
        "type": "numeric",
        "kind": "column"
      },
      {
        "key": "__2__",
        "name": "Year",
        "description": "Date value ",
        "type": "numeric",
        "kind": "column"
      },
      {
        "key": "__3__",
        "name": "Total",
        "description": "Measure to be mapped",
        "type": "numeric",
        "kind": "measure"
      }
    ]
  },
  "config": {
    "autosize": {
      "type": "fit",
      "contains": "padding"
    },
    "view": {"stroke": "transparent"},
    "font": "Segoe UI",
    "arc": {},
    "area": {
      "line": true,
      "opacity": 0.6
    },
    "bar": {},
    "line": {
      "strokeWidth": 3,
      "strokeCap": "round",
      "strokeJoin": "round"
    },
    "path": {},
    "point": {
      "filled": true,
      "size": 75
    },
    "rect": {},
    "shape": {},
    "symbol": {
      "strokeWidth": 1.5,
      "size": 50
    },
    "text": {
      "font": "Segoe UI",
      "fontSize": 12,
      "fill": "#605E5C"
    },
    "axis": {
      "ticks": false,
      "grid": false,
      "domain": false,
      "labelColor": "#605E5C",
      "labelFontSize": 12,
      "titleFont": "wf_standard-font, helvetica, arial, sans-serif",
      "titleColor": "#252423",
      "titleFontSize": 16,
      "titleFontWeight": "normal"
    },
    "axisQuantitative": {
      "tickCount": 3,
      "grid": true,
      "gridColor": "#C8C6C4",
      "gridDash": [1, 5],
      "labelFlush": false
    },
    "axisBand": {"tickExtra": true},
    "axisX": {"labelPadding": 5},
    "axisY": {"labelPadding": 10},
    "header": {
      "titleFont": "wf_standard-font, helvetica, arial, sans-serif",
      "titleFontSize": 16,
      "titleColor": "#252423",
      "labelFont": "Segoe UI",
      "labelFontSize": 13.333333333333332,
      "labelColor": "#605E5C"
    },
    "legend": {
      "titleFont": "Segoe UI",
      "titleFontWeight": "bold",
      "titleColor": "#605E5C",
      "labelFont": "Segoe UI",
      "labelFontSize": 13.333333333333332,
      "labelColor": "#605E5C",
      "symbolType": "circle",
      "symbolSize": 75
    }
  },
  "data": {"name": "dataset"},
  "facet": {
    "field": "__2__",
    "header": {
      "title": null,
      "labelAnchor": "start",
      "labelFont": "Segoe UI Light",
      "labelFontSize": 14,
      "labelColor": "black",
      "labelFontWeight": "bold"
    }
  },
  "spec": {
    "width": 150,
    "height": 80,
    "mark": {
      "type": "text",
      "text": "⬢",
      "size": 17
    },
    "encoding": {
      "x": {
        "field": "__1__",
        "type": "quantitative",
        "axis": null
      },
      "y": {
        "field": "__0__",
        "type": "quantitative",
        "sort": "descending",
        "axis": null
      },
      "color": {
        "field": "__3__",
        "type": "quantitative",
        "aggregate": "sum",
        "legend": {
          "title": null,
          "tickCount": 4,
          "gradientLength": 725,
          "gradientThickness": 15,
          "orient": "top",
          "format": "%"
        },
        "scale": {
          "scheme": "lightgreyteal"
        }
      }
    }
  },
  "columns": 4,
  "spacing": 25
}