
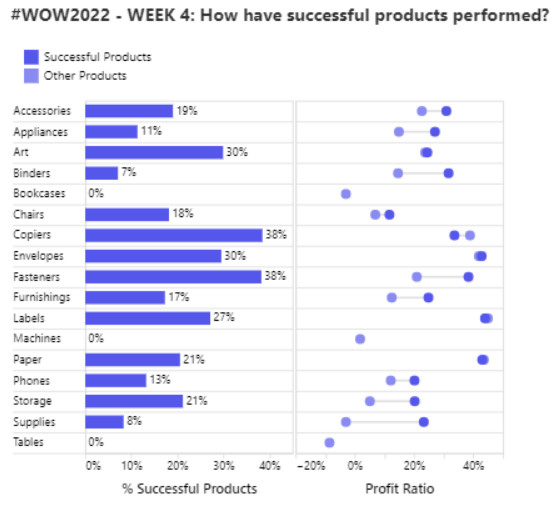
The chart was posted as part of the Tableau Workout Wednesday 2022. The Tableau chart was a challenge I posed myself. I wanted to show that with Deneb, PowerBI can be elevated to a next level visualization tool.
Dataset
The dataset can be found on the Workout Wednesday link above.
Additional fields created
% Successful Products
1
2
3
4
5
6
7
8
9
10
11
12
13
14
15
16
% Successful Products =
VAR __Successful =
CALCULATE(
    [# Products],
    'Product'[Product Type] = "Successful Products"
)

VAR __allproducts =
CALCULATE(
    [# Products],
    ALL('Product'[Product Type])
) + .0000000001 //added to display records with 0 values


RETURN
DIVIDE ( __Successful, __allproducts ) + .0000000001 //added to display records with 0 values
Profit Ratio
1
2
3
4
5
6
7
8
9
Profit Ratio =
VAR __Profit =
SUM ( Profit[Profit] )

VAR __Sales =
SUM ( Profit[Sales] )

RETURN
DIVIDE ( __Profit, __Sales )
Fields used
- Product-Category mapped to cat
- Product-Type mapped to typ
- Product-SubCategory mapped to sub
- % Successful Products mapped to per
- Profit Ratio mapped to rat
Specification
Since completion of this challenge, I’ve learned that there is an easier way to set the tick marks as in this example. See Axis > Ticks > tickBand for more details.
1
2
3
4
5
6
7
8
9
10
11
12
13
14
15
16
17
18
19
20
21
22
23
24
25
26
27
28
29
30
31
32
33
34
35
36
37
38
39
40
41
42
43
44
45
46
47
48
49
50
51
52
53
54
55
56
57
58
59
60
61
62
63
64
65
66
67
68
69
70
71
72
73
74
75
76
77
78
79
80
81
82
83
84
85
86
87
88
89
90
91
92
93
94
95
96
97
98
99
100
101
102
103
104
105
106
107
108
109
110
111
112
113
114
115
116
117
118
119
120
121
122
123
124
125
126
127
128
129
130
131
132
133
134
135
136
137
138
139
140
141
142
143
144
145
146
147
148
149
150
151
152
153
154
155
156
157
158
159
160
161
162
163
164
165
166
167
168
169
170
171
172
173
174
175
176
177
178
179
180
181
182
183
184
185
186
187
188
189
190
191
192
193
194
195
196
197
{
  "data": {"name": "dataset"},
  "title": {
    "text": [
      "#WOW2022 - WEEK 4: How have successful products performed?",
      ""
    ],
    "font": "Segoe UI",
    "color": "#333333",
    "fontSize": 17,
    "align": "left"
  },
  "hconcat": [
    {
      "layer": [
        {
          "mark": {
            "type": "bar",
            "height": {"band": 0.7},
            "tooltip": true
          },
          "encoding": {
            "y": {
              "field": "sub",
              "type": "nominal",
              "title": "",
              "axis": {
                "grid": true,
                "labelOffset": -10,
                "labelAlign": "left",
                "labelPadding": 0,
                "tickSize": 70,
                "tickOffset": 10,
                "labelFont": "Segoe UI",
                "labelFontSize": 11
              }
            },
            "x": {
              "aggregate": "mean",
              "field": "per",
              "type": "quantitative",
              "scale": {
                "domain": [0, 0.45]
              },
              "axis": {
                "titlePadding": 10,
                "title": "% Successful Products",
                "titleFont": "Segoe UI",
                "titleFontSize": 13,
                "titleFontWeight": 600,
                "format": "%",
                "grid": false,
                "labelFont": "Segoe UI",
                "labelFontSize": 11
              }
            },
            "color": {
              "value": "#5557EB"
            }
          }
        },
        {
          "mark": {
            "type": "text",
            "align": "left",
            "baseline": "middle",
            "dx": 3,
            "font": "Segoe UI",
            "fontSize": 11
          },
          "encoding": {
            "text": {
              "field": "per",
              "type": "nominal",
              "format": ".0%"
            },
            "x": {
              "aggregate": "mean",
              "field": "per",
              "type": "quantitative"
            },
            "y": {
              "field": "sub",
              "title": "",
              "type": "nominal"
            }
          }
        }
      ]
    },
    {
      "encoding": {
        "x": {
          "field": "rat",
          "type": "quantitative",
          "scale": {
            "domain": [-0.2, 0.5]
          },
          "axis": {
            "titlePadding": 10,
            "title": "Profit Ratio",
            "titleFont": "Segoe UI",
            "titleFontSize": 13,
            "titleFontWeight": 600,
            "format": "%",
            "minExtent": 10,
            "domain": false,
            "grid": false,
            "labelFont": "Segoe UI",
            "labelFontSize": 11
          }
        },
        "y": {
          "field": "sub",
          "type": "nominal",
          "title": "",
          "axis": {
            "grid": true,
            "labels": false,
            "labelOffset": -10,
            "labelPadding": -24,
            "tickSize": 0,
            "tickOffset": 10
          }
        }
      },
      "layer": [
        {
          "mark": "line",
          "encoding": {
            "detail": {
              "field": "sub",
              "type": "nominal"
            },
            "color": {
              "value": "#e0e0e0"
            }
          }
        },
        {
          "params": [
            {
              "name": "products",
              "select": {
                "type": "point",
                "fields": ["typ"]
              },
              "bind": "legend"
            }
          ],
          "mark": {
            "type": "point",
            "filled": true,
            "size": 90
          },
          "encoding": {
            "color": {
              "field": "typ",
              "scale": {
                "domain": [
                  "Successful Products",
                  "Other Products"
                ],
                "range": [
                  "#5557EB",
                  "#8A8BF1"
                ]
              },
              "title": null,
              "legend": {
                "legendX": -60,
                "legendY": -50,
                "orient": "none",
                "labelFont": "Segoe UI",
                "labelFontSize": 12,
                "symbolType": "square",
                "symbolSize": 200
              }
            },
            "opacity": {
              "condition": {
                "param": "products",
                "value": 1
              },
              "value": 0.2
            }
          }
        }
      ],
      "resolve": {
        "legend": {
          "opacity": "independent"
        }
      }
    }
  ]
}
Config
1
2
3
4
5
6
7
8
9
10
11
12
13
14
15
16
{
  "autosize": {
    "type": "fit",
    "contains": "padding"
  },
  "facet": {"spacing": 0},
  "axis": {
    "domainColor": "#ddd",
    "tickColor": "#ddd"
  },
  "concat": {"spacing": 0},
  "view": {
    "stroke": "#ddd",
    "domain": true
  }
}
External references
- Ranged Dot Plot - used as the starting point.
- Horizontal Concatenation - used to combine the two charts.
- Legend binding - highlight product selected by clicking the legend.
View chart
No chart view available.