
The chart was posted as part of the Workout Wednesday PowerBI challenge.
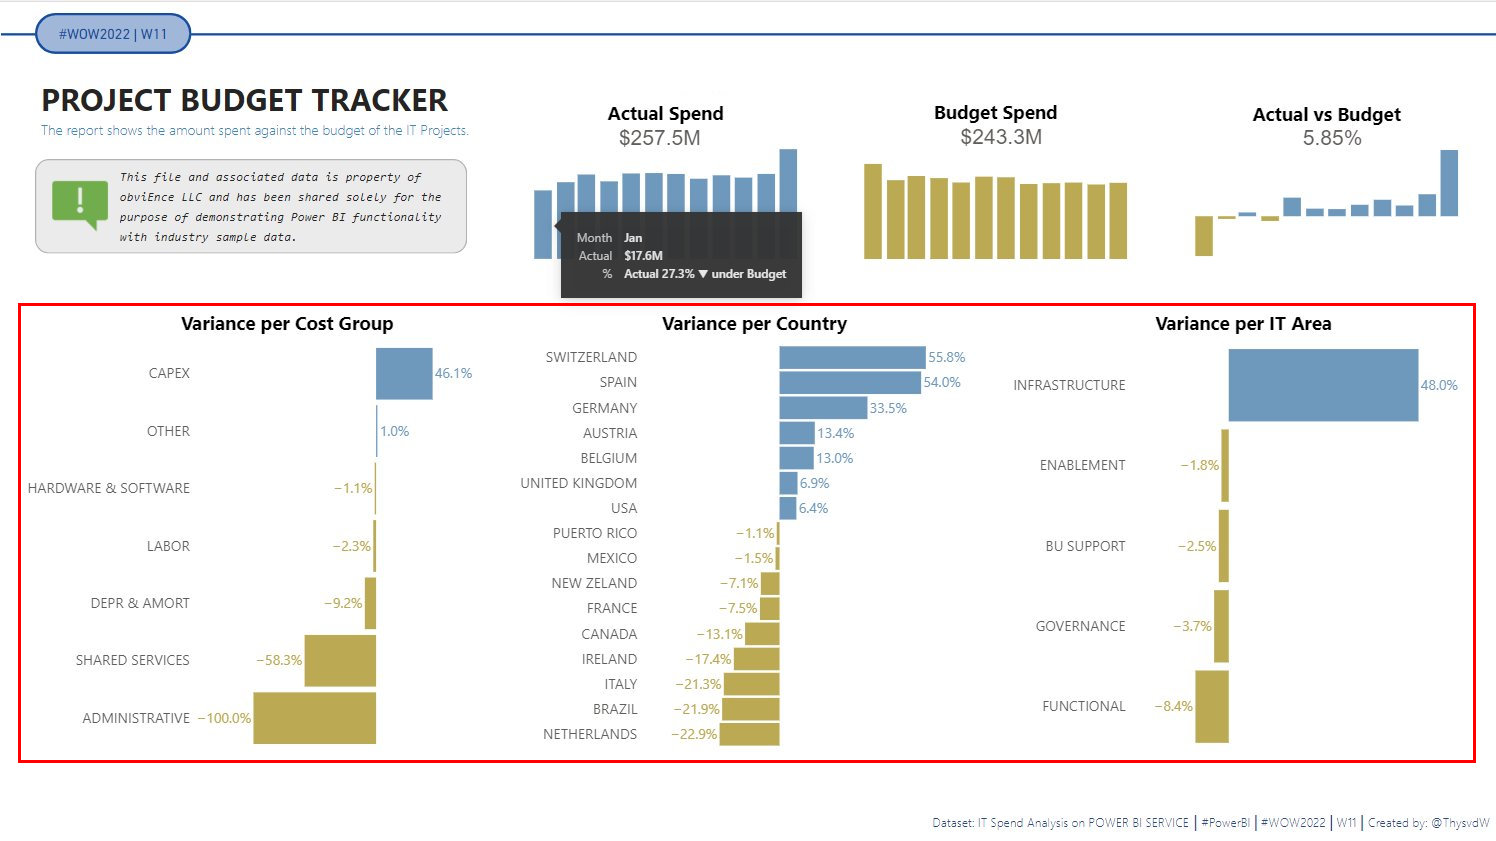
I am only going to provide the specification and configuration for the Cost Group bar chart. The others is similar in their approach.
Dataset
The dataset can be found on the Workout Wednesday link above.
Additional fields created
Actual CM
1
2
3
4
5
6
7
8
9
10
11
12
13
14
15
Actual CM =
VAR __previousMonth =
CALCULATE (
    [Actual],
    PREVIOUSMONTH('Date'[Date])
)

VAR __currentMonth =
[Actual]

VAR __month =
__currentMonth - __previousMonth

RETURN
    __month
Plan CM
1
2
3
4
5
6
7
8
9
10
11
12
13
14
15
Plan CM =
VAR __previousMonth =
CALCULATE (
    [Plan],
    PREVIOUSMONTH('Date'[Date])
)

VAR __currentMonth =
[Plan]

VAR __month =
__currentMonth - __previousMonth

RETURN
    __month
Var MO
1
2
Var MO =
[Actual CM] - [Plan CM]
Var MO%
1
2
Var MO % =
DIVIDE ( [Var MO], [Plan CM] )
Fields used
- [Cost Element Group] AS group
- [Var MO %] AS diff
Specification
1
2
3
4
5
6
7
8
9
10
11
12
13
14
15
16
17
18
19
20
21
22
23
24
25
26
27
28
29
30
31
32
33
34
35
36
37
38
39
40
41
42
43
44
45
46
47
48
49
50
51
52
53
54
55
56
57
58
59
60
61
62
63
64
65
66
67
68
69
70
71
72
73
74
75
76
77
78
79
80
81
82
83
84
85
86
87
88
89
90
91
{
  "title": {
    "text": "Variance per Cost Group",
    "font": "Segoe UI",
    "dx": -55,
    "fontSize": 16
  },
  "transform": [
    {
      "calculate": "upper(datum.group)",
      "as": "grp"
    }
  ],
  "encoding": {
    "y": {
      "field": "grp",
      "type": "nominal",
      "sort": {
        "op": "mean",
        "field": "diff",
        "order": "descending"
      },
      "axis": {
        "title": null,
        "labelPadding": 55
      }
    }
  },
  "data": {"name": "dataset"},
  "layer": [
    {
      "mark": {"type": "bar"},
      "encoding": {
        "x": {
          "field": "diff",
          "type": "quantitative",
          "axis": null
        },
        "color": {
          "condition": {
            "test": "datum.diff < 0",
            "value": "#bda94e"
          },
          "value": "#6d98bd"
        },
        "tooltip": [
          {
            "field": "group",
            "type": "nominal",
            "title": "Group"
          },
          {
            "field": "diff",
            "type": "quantitative",
            "title": "% Variance"
          }
        ]
      }
    },
    {
      "mark": {
        "type": "text",
        "align": {
          "expr": "datum.diff < 0 ? 'right' : 'left'"
        },
        "dx": {
          "expr": "datum.diff < 0 ? -2 : 2"
        }
      },
      "encoding": {
        "text": {
          "field": "diff",
          "type": "quantitative",
          "format": ".1%"
        },
        "x": {
          "field": "diff",
          "type": "quantitative",
          "axis": null
        },
        "color": {
          "condition": {
            "test": "datum.diff < 0",
            "value": "#bda94e"
          },
          "value": "#6d98bd"
        }
      }
    }
  ]
}
Config
1
2
3
4
5
6
7
8
9
10
11
12
13
14
15
16
17
18
19
20
21
22
23
24
25
26
27
28
29
30
31
32
33
34
35
36
37
38
39
40
41
42
43
44
45
46
47
48
49
50
51
52
53
54
55
56
57
58
59
60
61
62
63
64
65
66
67
68
69
70
71
{
  "autosize": {
    "type": "fit",
    "contains": "padding"
  },
  "view": {"stroke": "transparent"},
  "font": "Segoe UI",
  "arc": {},
  "area": {
    "line": true,
    "opacity": 0.6
  },
  "bar": {},
  "line": {
    "strokeWidth": 3,
    "strokeCap": "round",
    "strokeJoin": "round"
  },
  "path": {},
  "point": {"filled": true, "size": 75},
  "rect": {},
  "shape": {},
  "symbol": {
    "strokeWidth": 1.5,
    "size": 50
  },
  "text": {
    "font": "Segoe UI",
    "fontSize": 12,
    "fill": "#605E5C"
  },
  "axis": {
    "ticks": false,
    "grid": false,
    "domain": false,
    "labelColor": "#605E5C",
    "labelFontSize": 12,
    "titleFont": "wf_standard-font, helvetica, arial, sans-serif",
    "titleColor": "#252423",
    "titleFontSize": 16,
    "titleFontWeight": "normal"
  },
  "axisQuantitative": {
    "tickCount": 3,
    "grid": true,
    "gridColor": "#C8C6C4",
    "gridDash": [1, 5],
    "labelFlush": false
  },
  "axisBand": {"tickExtra": true},
  "axisX": {"labelPadding": 5},
  "axisY": {"labelPadding": 10},
  "header": {
    "titleFont": "wf_standard-font, helvetica, arial, sans-serif",
    "titleFontSize": 16,
    "titleColor": "#252423",
    "labelFont": "Segoe UI",
    "labelFontSize": 13.333333333333332,
    "labelColor": "#605E5C"
  },
  "legend": {
    "titleFont": "Segoe UI",
    "titleFontWeight": "bold",
    "titleColor": "#605E5C",
    "labelFont": "Segoe UI",
    "labelFontSize": 13.333333333333332,
    "labelColor": "#605E5C",
    "symbolType": "circle",
    "symbolSize": 75
  }
}
External references
- Horizontal Bar Chart with Negative Values and Labels - used as the starting point.
- Conditional KPI Cards with Deneb - I used Kerry’s logic for coloring positive and negative values.
View chart
Due to the data being only made available via the PowerBI application, no chart view is available.