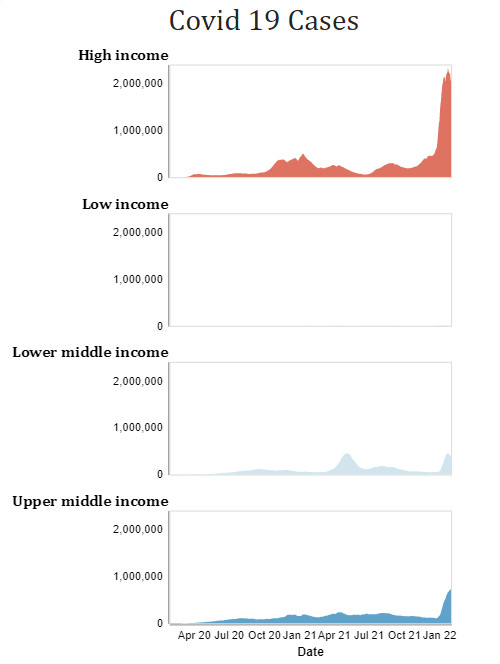
This chart was part of my submission for Week 5 Workout Wednesday challenge.
Dataset
The dataset can be found on the Workout Wednesday link above.
Additional fields created
None
Fields used
- date
- location
- new_cases_smoothed
Specification
1
2
3
4
5
6
7
8
9
10
11
12
13
14
15
16
17
18
19
20
21
22
23
24
25
26
27
28
29
30
31
32
33
34
35
36
37
38
39
40
41
42
43
44
45
46
47
48
49
50
51
{
  "data": {"name": "dataset"},
  "mark": "area",
  "width": 250,
  "height": 100,
  "encoding": {
    "x": {
      "field": "date",
      "type": "temporal",
      "title": "Date",
      "axis": {
        "grid": false,
        "ticks": false,
        "labelPadding": 5,
        "format": "%b %y"
      }
    },
    "y": {
      "field": "new_cases_smoothed",
      "type": "quantitative",
      "title": "",
      "axis": {
        "grid": false,
        "ticks": false,
        "labelPadding": 5
      }
    },
    "color": {
      "field": "location",
      "type": "nominal",
      "legend": null,
      "scale": {"scheme": "redblue"}
    },
    "row": {
      "field": "location",
      "type": "nominal",
      "title": null,
      "header": {
        "labelOrient": "",
        "labelBaseline": "line-bottom",
        "labelAngle": 0,
        "labelAnchor": "end",
        "labelFont": "Cambria",
        "labelFontSize": 14,
        "labelFontWeight": "bold",
        "labelPadding": 10
      },
      "spacing": 30
    }
  }
}
Note that line 39 of the code will produce a warning as there is no value entered for labelOrient. I used this as it provided me with the correct location. 😏
Config
1
2
3
4
5
6
{
  "autosize": {
    "type": "fit",
    "contains": "padding"
  }
}
External references
- Trellis Area - used as the starting point.
- Format configuration - used to change the date format for the x-axis.
- Color Schemes - used to find a suitable color scheme
View chart
No chart view available.
