
This chart was part of the PowerBI Workout Wednesday challenge.
Dataset
The dataset can be found at the link above.
Additional fields created
Rank
1
2
3
4
5
6
7
8
9
  Rank =
    VAR __Rank =
    RANKX (
        ALLEXCEPT( 'State Migration','State Migration'[State To]),
        CALCULATE(SUM('State Migration'[Population Moving]))
    )

    RETURN
        __Rank
Fields used
- From
- To
- Rank
Specification
1
2
3
4
5
6
7
8
9
10
11
12
13
14
15
16
17
18
19
20
21
22
23
24
25
26
27
28
29
30
{
"data": {"name": "dataset"},
"mark": "rect",
"width":450,
"height":450,
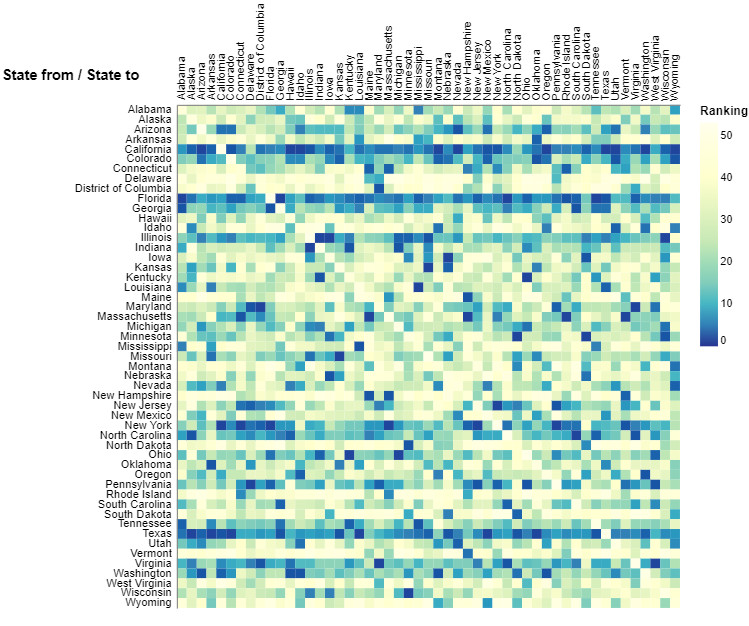
"encoding": {
"x": {
"field": "to",
"title": " ",
"type": "nominal"
},
"y": {
"field": "from",
"title": "State from / State to",
"type": "nominal"
},
"color": {
"field": "rank",
"legend": {
"title":"Ranking"
},
"scale": {
"domain": [0, 5, 10, 15, 25, 40, 53],
"range": ["#ffffcc","#c7e9b4","#7fcdbb","#41b6c4","#2c7fb8","#253494"]
},
"sort":"descending",
"type": "quantitative"
}
}
}
Config
1
2
3
4
5
6
7
8
9
10
11
12
13
14
15
16
17
18
19
20
21
22
23
24
25
{
  "view": {
    "continuousWidth": 400,
    "continuousHeight": 300,
    "strokeWidth": 0
  },
  "axisX": {
    "grid": false,
    "labelFont": "Arial",
    "labelFontSize": 10,
    "labelPadding": 5,
    "orient": "top",
    "ticks": false
  },
  "axisY": {
    "grid": false,
    "labelFont": "Arial",
    "labelFontSize": 10,
    "labelPadding": 5,
    "ticks": false,
    "titleAngle": 0,
    "titleFontSize": 13,
    "titleY": -20
  }
}
External references
- Annual Weather Heatmap - used as the starting point.
- Axis configuration - used to change the label orientation on the x-axis and to set the location of the title on the y-axis.
View chart
No chart view available.