
This chart was part of my submission for the Week 13 Workout Wednesday challenge. I did not think it necessary to add a post for this, but I was requested to add it - so here goes.
Dataset
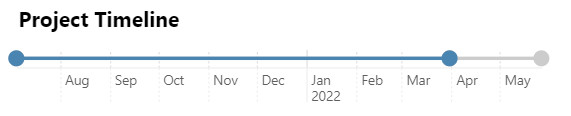
The dataset is part of the presentation on the Workout Wednesday challenge. The data was entered into a table using Power Query enter data. The table had two columns, the description and a date column. I added three entries to it, namely the project start, Today’s date and the Expected end date. I added an index field to allow me to filter the dataset in Deneb. Index was based upon the date sequence.
You can use the now() function in Vega-lite to add an additional field.
Additional fields created
None
Fields used
- Description
- Date
- Index
Specification
I learned that you can export the JSON as a template - never to old to learn something new!
The specification in a nutshell:
Layer
  * point marks for all dates in gray scale
  * line connecting all dates in gray scale
  Layer
    * point marks for start date and today's date in blue color
    * line connecting the two dates in blue color
Config
See the JSON template section of this post.
External references
- Ranged Dot Plot - used as the starting point.
View chart
Open the Chart in the Vega Editor
JSON template
1
2
3
4
5
6
7
8
9
10
11
12
13
14
15
16
17
18
19
20
21
22
23
24
25
26
27
28
29
30
31
32
33
34
35
36
37
38
39
40
41
42
43
44
45
46
47
48
49
50
51
52
53
54
55
56
57
58
59
60
61
62
63
64
65
66
67
68
69
70
71
72
73
74
75
76
77
78
79
80
81
82
83
84
85
86
87
88
89
90
91
92
93
94
95
96
97
98
99
100
101
102
103
104
105
106
107
108
109
110
111
112
113
114
115
116
117
118
119
120
121
122
123
124
125
126
127
128
129
130
131
132
133
134
135
136
137
138
139
140
141
142
143
144
145
146
147
148
149
150
151
152
153
154
155
156
157
158
159
160
161
162
163
164
165
166
167
168
169
170
171
172
173
174
175
176
177
178
179
180
181
182
183
184
185
186
187
188
189
190
191
192
193
194
195
196
197
198
199
200
201
202
203
204
205
206
{
  "$schema": "https://vega.github.io/schema/vega-lite/v5.json",
  "usermeta": {
    "deneb": {
      "build": "1.1.0.0",
      "metaVersion": 1,
      "provider": "vegaLite",
      "providerVersion": "5.2.0"
    },
    "interactivity": {
      "tooltip": true,
      "contextMenu": true,
      "selection": true,
      "dataPointLimit": 50
    },
    "information": {
      "name": "The one with the timeline",
      "description": "A small template to generate a timeline plot, with a start and end date, and current tracking date.",
      "author": "Thys van der Westhuizen",
      "uuid": "9007c352-fff4-49d5-975b-1cbc9a4e4d96",
      "generated": "2022-04-04T15:38:39.046Z"
    },
    "dataset": [
      {
        "key": "__0__",
        "name": "Description",
        "description": "Describe the date value (i.e. Project start date)",
        "type": "text",
        "kind": "column"
      },
      {
        "key": "__1__",
        "name": "Date",
        "description": "Dates that you want to show on timeline",
        "type": "dateTime",
        "kind": "column"
      },
      {
        "key": "__2__",
        "name": "Index",
        "description": "Sort Id",
        "type": "numeric",
        "kind": "measure"
      }
    ]
  },
  "config": {
    "autosize": {
      "type": "fit",
      "contains": "padding"
    },
    "view": {"stroke": "transparent"},
    "font": "Segoe UI",
    "arc": {},
    "area": {
      "line": true,
      "opacity": 0.6
    },
    "bar": {},
    "line": {
      "strokeWidth": 3,
      "strokeCap": "round",
      "strokeJoin": "round"
    },
    "path": {},
    "point": {
      "filled": true,
      "size": 75
    },
    "rect": {},
    "shape": {},
    "symbol": {
      "strokeWidth": 1,
      "size": 50
    },
    "text": {
      "font": "Segoe UI",
      "fontSize": 12,
      "fill": "#605E5C"
    },
    "axis": {
      "domainColor": "#eee",
      "tickColor": "#eee",
      "labelColor": "#605E5C",
      "labelFontSize": 12,
      "titleFont": "wf_standard-font, helvetica, arial, sans-serif",
      "titleColor": "#252423",
      "titleFontSize": 16,
      "titleFontWeight": "normal"
    },
    "axisQuantitative": {
      "tickCount": 3,
      "grid": true,
      "gridColor": "#ddd",
      "gridDash": [1, 5],
      "labelFlush": false
    },
    "axisBand": {"tickExtra": true},
    "axisX": {"labelPadding": 5},
    "axisY": {"labelPadding": 10},
    "header": {
      "titleFont": "wf_standard-font, helvetica, arial, sans-serif",
      "titleFontSize": 16,
      "titleColor": "#252423",
      "labelFont": "Segoe UI",
      "labelFontSize": 12,
      "labelColor": "#605E5C"
    },
    "legend": {
      "titleFont": "Segoe UI",
      "titleFontWeight": "bold",
      "titleColor": "#605E5C",
      "labelFont": "Segoe UI",
      "labelFontSize": 12,
      "labelColor": "#605E5C",
      "symbolType": "circle",
      "symbolSize": 75
    }
  },
  "data": {"name": "dataset"},
  "encoding": {
    "x": {
      "field": "__1__",
      "type": "temporal",
      "axis": {
        "title": null,
        "tickCount": 8,
        "labelAlign": "left",
        "labelExpr": "[timeFormat(datum.value, '%b'), timeFormat(datum.value, '%m') == '01' ? timeFormat(datum.value, '%Y') : '']",
        "labelOffset": 4,
        "labelPadding": -24,
        "tickSize": 30,
        "gridDash": {
          "condition": {
            "test": {
              "field": "value",
              "timeUnit": "month",
              "equal": 1
            },
            "value": []
          },
          "value": [2, 2]
        },
        "tickDash": {
          "condition": {
            "test": {
              "field": "value",
              "timeUnit": "month",
              "equal": 1
            },
            "value": []
          },
          "value": [2, 2]
        }
      }
    },
    "y": {
      "datum": 10,
      "type": "nominal",
      "axis": null
    }
  },
  "layer": [
    {
      "mark": {"type": "point"},
      "encoding": {
        "size": {"value": 200},
        "opacity": {"value": 1},
        "color": {"value": "#cccccc"}
      }
    },
    {
      "mark": "line",
      "encoding": {
        "color": {"value": "#cccccc"}
      }
    },
    {
      "transform": [
        {
          "filter": "datum['__2__'] != 3"
        }
      ],
      "layer": [
        {
          "mark": "line",
          "encoding": {
            "color": {
              "value": "#4883b2"
            }
          }
        },
        {
          "mark": {"type": "point"},
          "encoding": {
            "size": {"value": 200},
            "color": {
              "value": "#4883b2"
            },
            "opacity": {"value": 1}
          }
        }
      ]
    }
  ]
}
<!– end of json template>